We hope this Quarterly Update finds our readers healthy and "carrying on" during a year that many will never forget. As part of our continued commitment to enhancing our investor experience and providing some additional structure to these reports, once again we added a Table of Contents and Summary below to assist time constrained readers with navigating to their preferred section or getting a quick general take.
- Our FUND UPDATES can be found on this page and the top of the next page.
- IN REAL ESTATE MARKET CONDITIONS we discuss our general opinions on how office using employers (and their employees) continue to adapt and our current or "house view "on the alarming headlines we are seeing such as "The Death of Office" and "The Future of Office Leasing...Died?" and our favorite "Most Productive Workspace?...Might Be the Pub" Page 2. Bottom line, rumors of the death of office are premature.
- In REAL ESTATE MARKET CONDITIONS 2.0 we highlight the movement of capital within the broader real estate sectors as of mid-year 2020. Also highlighted are some key statistics on office fundamentals within three of our target markets. Page 7.
- Our Macro-Economic Conditions analysis begins on page 11 with an assessment of Current Conditions – U.S. economy partially but not fully recovered, and labor market plateauing. Followed by some thoughts on the Short-Term Impact of Fiscal Rescue (page 13)- Perhaps a small inflationary uptick, albeit transitory; widening trade deficits and probably lower investment if consumer habits normalize to pre-pandemic patterns.
- Macro-Economic Conditions continue with the Long-Term Impact of More Debt (page 16) – Low interest rates and even more debt will pile up as we grind toward an eventual breaking point. What might that breaking point be? Read the section for a few thoughts.
Fund Updates
This marks our third consecutive quarter reporting on the impact of COVID-19 on the portfolio. We continue to remain cautiously optimistic about the overall impact. A few take-aways since last quarter; for Fund II and Fund III, rent collections are running high at 98% since September, we have completed 15 tenant rent deferrals or just under 5% of the combined portfolio's occupied area, and 4 tenants (approximately 0.8% or 21,500 sf of the portfolio) have filed for bankruptcy as a direct result of COVID19. The Managers Letter herein (full Fund performance reports only) has further details on our efforts to maintain the performance of all the portfolio assets under these unique circumstances.
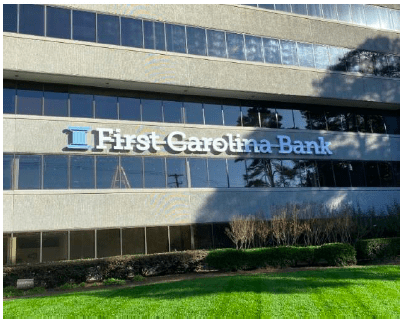
Fund II: As mentioned in our Q1-2020 report, we recently signed First Carolina Bank to a full floor lease, at Carolina Place. The bank's suite is under construction now, and they will take occupancy early next year. We are also happy to report on the recent installation of the bank's new eyebrow sign on the second floor facing Glenwood Avenue (photo on next page). The tenant is excited to move-in, and the build-out is on-time and on budget.
 Fund III: During the quarter we continued to make progress with the Callis Road Industrial Project in Nashville, TN, now formally named "Park 109". Since purchasing the land in July, we closed a $20.6M construction loan with CrossFirst Bank. Further, the capital stack was completed via a successful equity raise of $6.25 million through a joint fundraising effort between Griffin Partners and CrowdStreet (an online syndication equity funding platform). A big thank you to all Griffin Partners investors who choose to participate in this deal alongside Fund III. Cushman & Wakefield has been hired to market the Project, and most importantly, the TEAM, which includes our local partner CA South, recently broke ground on the site! As of the first week of November, the project's general contractor, Harvey-Cleary Builders, is now on site and has begun clearing areas to prep for demolition and fill for the building foundations (photo below). By this time next year, the site will be nearly complete with four industrial buildings erected ranging in size from 75,000sf to 100,000sf for a total of 375,000sf.
 The Fund III portfolio faces no near-term debt maturities and, excluding any extensions or modifications, the majority of initial maturities occur in early 2024. Furthermore, as of today, except for 200 Union and its upcoming extension and modification agreement, which is in the works, the portfolio's next significant debt maturity does not occur until March 2023. Fund III remains conservatively leveraged at 58% loan-to-cost, and as a result Fund III is well insulated against a recessionary environment.
Real Estate Market Conditions
While watching physical utilization fall throughout our portfolio in March and April due to COVID, we've closely monitored each of our asset's physical occupancy levels since March. Starting in May, we witnessed a slow stream of occupants returning to their offices and a subsequent steady rise of activity since mid-June. While our portfolio of assets is a small sample set across six states, it provides a framework through which to observe the steady return of office users and the resulting increase in office occupancy generally since the peak of lockdowns. The big unanswered question is what will happen to office-use over the long-term, and will it ever return to pre-COVID levels? Our opening comments alluded to the increase in alarming headlines including "The Death of Office" and "The Future of Office Leasing…Died?" Are these headlines accurate? Frankly, we don't know with certainty the exact answer, and if anyone tells you otherwise, they are most probably full of it! However, based on our experience and research we have formed a view that office-use is here to stay, and it should return to previous occupancy levels after some near-term demand destruction slightly above normal for a recessionary period. Quietly, beneath the alarming headlines, several key corporate technology players are committing to office-use. For example, the CEO of Google stated last month "….we firmly believe that in-person, being together, having a sense of community is super important when you have to solve hard problems and create something new so we don't see that changing…". It's also worth noting that on July 28, 2020, Google reaffirmed its intent to occupy a "horizontal" skyscraper known as the "landscaper", pictured, totaling 650,000 square feet next to King's Cross station in London; a new building which will deliver in July 2021. Google plans to move thousands of workers there once it's complete. In another example closer to home, Amazon recently announced it will invest $15,000,000 into a Dallas "tech hub" located in the Galleria Towers complex totaling approximately 85,000 square feet "for office use with open cubicle areas, conference and huddle rooms and breakrooms" on four floors. It is worth noting that is an investment of over $175 per square foot by AMZ within the space. Continued announcements like these from key decision makers making up the next generation of office users helps substantiate our view that the use of office space is not dead.
Some architects and commercial real estate (CRE) use forecasters are making the case that suburban office assets will outperform competing assets located in urban cores due to what is being dubbed the "hub and spoke" approach where corporate users will compliment headquarters locations in dense areas with multiple smaller locations in less dense suburban areas to provide more mobile employees a place to periodically gather, meet and work in an office environment separate from HQ. Such a "migration" from urban core to suburban would be beneficial to our investment thesis and current portfolio. We touched on this theme in our Q1-2020 report authored at the peak of the COVID lock downs. At the time we opined that the suburban migration was already underway as a result of millennial household formation, and that COVID was merely accelerating the trend.
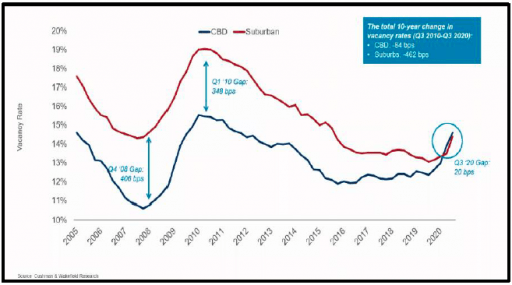 Is there any further evidence two quarters later? A Cushman & Wakefield September 2020 report, "Global Office Impact Study & Recovery Timing" indicates office employment trends continue to increase as a percent of overall jobs and provides some confirming evidence to our assertion of COVID accelerating a suburban migration with the observation that suburban markets began narrowing the vacancy gap with CBD submarkets in 2017 and have now completely closed the gap which dates back to at least 2005.
The current issue is how Work-FromHome (WFH) will impact on-going demand for office space in the future and for how long. As we mentioned in Q1- 2020 report, most employees want to return to the workplace. A recent survey by the global architecture firm Gensler indicates "only 12% of the U.S. workers want to work from home full-time." The baseline scenario in Cushman's & Wakefield's report calls for office demand to be 15.8% lower than it otherwise would be due to a structural increase in WFH, holding density at pre-COVID-19 levels. This negative outlook does not include any effect from "de-densification" where occupiers are more safety conscience and start to require more office space per employee. We have heard some anecdotal indications of dedensification, but there is very little empirical evidence at this point. Our gut tells us there will be a balance between WFH and companies requiring employees to be present, coupled with increasing worker's footprints or "dedensification" due to health safety requirements. It's unclear or just too early to tell if these changes are permanent, but, going forward, these dynamics will have a direct impact on overall office demand over the next several years. Rest assured; we will keep a close eye on these trends.
Historical evidence indicates office using environments adapt and inevitably return to the mean growth trend when economies expand. Conversely, in times of recession, occupiers significantly reduce space requirements, and COVID has amplified this normal recessionary space give back. Another recent research report from Cushman & Wakefield in partnership with The Center for Real Estate and Urban Analysis at Georgetown University demonstrated the breadth and adoption of the WFH experiment when it stated that "…office workers have been somewhat more insulated from this economic devastation as they learned to work out of home offices, many adapting to makeshift spaces in basements, bedrooms and kitchens." Further, per a May 2020 Stanford University survey, "up to 60% of U.S. economic output was dependent on working from home, with 42% of all workers working from home". This COVID driven experiment is the reason for the very idea of "the office" being rethought as workers find working from home not only possible, but, in some cases, preferable depending on the work type. Playing into our overall house view, this publication goes on to state although WFH is possible, a key take-away is "every organization studied, ultimately, still utilized office space".
In our view, for office using employment to return, employees (and employers' encouragement) will be dependent upon 1) productivity or output, and 2) innovation or creativity from collaboration. We chose the "less is more" strategy of only summarizing two key items, as there are numerous factors for employees to benefit from returning to their office such as the building's location, key decision makers central command area, workplace culture, employee satisfaction, mentorship, and retention, etc. Summarizing each would be an extensive read.
Regarding the first factor, the rapid pace of adoption for this WFH experiment (emergency) evolved in early 2020 as "...mobile technology…..produced results which in turn saved thousands of companies from having to shut down and sparing millions of job losses…." according to IA Architectsin a published report titled "Did Work-From-Home Really Work?" This trial by fire worked to save many lives by "flattening the curve", but will continuing along with this WFH strategy impact the bottom line of companies? We believe the current circumstances are not sustainable, especially 100% remote working as it will not generate ample employee productivity.
We also learned that the WFH environment immediately changed how we do business and how we collaborate with our peers within in a company. For example, again from the IA Architects report, "….meetings increased, turned inward, purposes changed, meetings got longer, employees felt less informed, productive time decreased, working units felt more siloed, social capital or engagement decreased." These factors led to employees wanting to "check-in" more often which is counterproductive. The study found "Internal meetings—those with people within the same company— increased to more than 60% of overall weekly meetings during WFH, while meetings with people external to the organization decreased to less than 40%. This runs counter to most organizations pursuing increased external orientation and awareness for their employees." That ratio is an inversion from the pre-COVID norm, and as the report suggests, is counter to most organizations' pursuit of new business. These issues suggest to us employers will strongly prefer most employees return to the office, restoring better person-to-person interactions that breed innovation, creativity, collaboration and quality mentorship.
Not to belabor the point, but this "rapid fire experiment" of WFH is counterproductive and all these items rolled together create fewer innovations and create systemic problems. Nicholas Bloom, a leading economics professor at Stanford suggested "…there may be steep opportunity cost paid down the line…that a collapse in the office face time will lead to a slump in innovation.
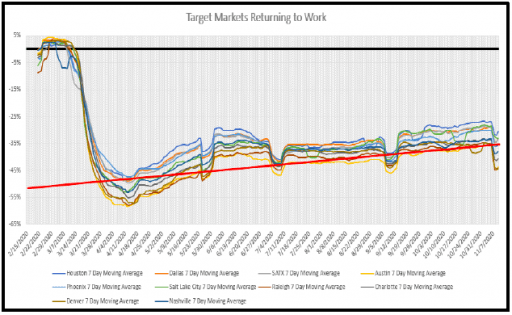 The utilization data being tracked by our "on the ground" property TEAMS tell us that physical occupancies have increased across our portfolio. Our analysts TEAM completed a brief survey of traffic patterns since February in our ten target markets compiled from CoStar data. The chart of the data from CoStar seen nearby reveals that all of our target markets have witnessed a gradual positive trend of employees returning to work. Surprisingly, Houston (hard to see dark blue line) is leading the pack with folks getting back to the office, and Austin (yellow line) is the laggard compared to the other markets.
A recent October 2020 article from CoStar entitled "Where Workers Return to the Office, Homebuilders Show Record Confidence, Airports Reach a Pandemic First", illustrates these trends reporting "….Houston saw a nation-leading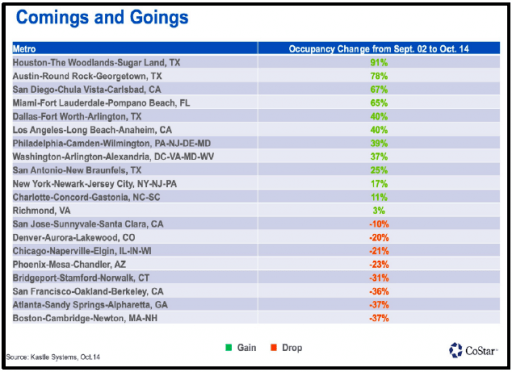 91% increase in employees leaving home for the office over the six weeks ending in mid-October, according to Kastle Systems (access card entry company)." Although this is just a glimpse in time, it does provide quantifiable evidence of how businesses are dealing with the pandemic. Furthermore, the data also showed Austin had the second highest growth over this time period with 78% change in occupancy, with office occupancies now hitting about 65%.
In short, a gradual and steady return to work with some remaining uncertainty about long-term utilization but the likelihood that office demand destruction resulting from the COVID recession will not be significantly worse than a typical recession.
Real Estate Market Conditions 2.0
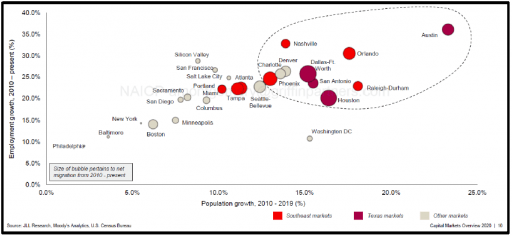
Now that the data is in as of mid-year 2020, we will summarize capital flows and highlight specific office demand conditions in a few of our target markets. A quick reminder that Griffin Partners' office exposure relative to industrial is expected to decline over the next several years but will still be a meaningful part of our CRE investment portfolio. The following graphic comes from JLL Capital Markets CEO Mark Gibson's presentation on the state of the CRE capital markets and clearly highlights the economic and demographic outperformance our ten target markets have achieved from 2010 through 2019. The only market of our ten targets not in the upper right circled quadrant is Salt Lake City because its employment growth has outstripped its population growth, which is fine by us!
As both Fund II & III mature, we continue to be daily participants in the pipeline of new offerings within our target markets to maintain our understanding of capital flows, observe the real estate fundamentals of each sector, and prepare for deployment of capital from our next fund which will kick off in Q1-2021. Additionally, understanding capital flows provides an advantage in strategic decision making with our existing investments, including important strategic decisions such as cash distributions, asset level capital expenditures, and lease negotiations to name a few. In 2019, capital flows into secondary markets maintained a decent clip, albeit at a slightly slower pace than 2018, and since the first half of 2020, capital flows stalled due to the pandemic. We believe that as the pandemic subsides and the economy stabilizes and recovers, capital flows will quickly ramp up as a result of the record amounts of "dry powder" for CRE investments driven by the reach for yield in a low interest rate environment.
Q3-2020 was a step in the right direction for CRE investment levels to return towards historical norms. The overall US Real Estate market saw over $61.0 billion of investment volume in the quarter, up 33.9% from the recent market bottom of $45.8 billion in Q2. While this increase is significant and a positive sign of investor confidence, it remains a 60.4% year-over-year decrease from $154.9 billion of investment activity in Q3-2019, per CBRE's Q3 2020 U.S. Capital Markets Figures.
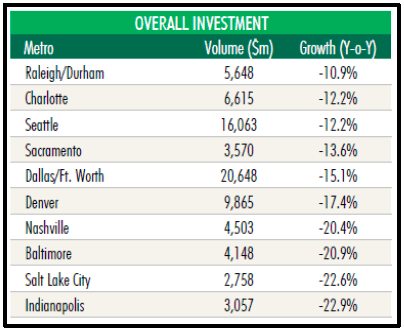 The year-over-year decline in investment volume is most pronounced in the large gateway markets (LA, SF, NYC, DC, Etc.). This may be due in part to their dependence on public transportation networks to function, therefore making them more vulnerable to the effects of highly contagious diseases like COVID19. The largest declines in CRE investment activity occurred in San Diego (-47.9%), Austin (-45.3%) an outlier in our opinion, New York City (-43.7%), and San Francisco (-42.8%). Overall, our target markets were more insulated from this illiquidity and remained active. Our guess is this liquidity inversion is a first for a few "Primary" markets, such as San Francisco and New York, which are accustomed to outperforming "Secondary" market in terms of investment activity volume! The graphic to the left from CBRE's Q3 2020 U.S. Capital Markets Figures shows the ten (10) markets with the highest year-over-year investment growth (smallest decline) as of Q3. As you can see,six (6) of our target markets (Raleigh, Charlotte, Dallas, Denver, Nashville, Salt Lake City) were included with two in podium positions. This outstanding news further supports our overall thesis to concentrate our portfolio into young, growing, and dynamic cities with diversified economies that promote a pro-business environment. It appears that the relative dispersion of population in these cities have allowed them to weather the pandemic, so far, better than more congested cities such as Chicago, New York City or San Francisco.
Office-using jobs remain the best measure of future office demand. Prior to COVID, our target markets have averaged 3.0% office-using job growth per year for the last 10 years, nearly twice the national average of 1.7% per year over the same time period (BLS).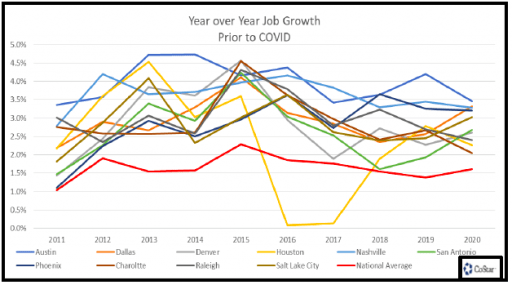 This above average growth is not random; it stems from attributes found in these cities which create an ecosystem conducive to population and economic growth. These attributes include low cost of living, strong education institutions, business friendly state and city governments, mild climates, good outdoor recreation activities, and easy transportation. As the chart of CoStar data nearby summarizes, the red line is the national average and every one of our target markets, except for Houston in 2016, consistently outperformed the US growth.
COVID's impact to the real estate market, as with other industries, was nuanced. The retail and hospitality sectors displayed severe impacts. The industrial sector shows almost no negative effect and possibly even a slight benefit given the increased e-commerce activity produced by COVID. Lastly, the Office and Multifamily sectors are somewhere in the middle.
Looking to office-using jobs as the best indicator of office demand, our target markets averaged, per BLS data, an 11.4% decrease in jobs from the high in February to the low in April, compared to the national average of 13.7%. From April to September, they rebounded 6.1%, ending with a net decrease in officeusing jobs of 5.3%, compared to the national average of 6.1%. Our premier markets during the ongoing COVID-19 pandemic have been Salt Lake City, Denver, and Austin which recovered to only a 2.8%, 3.6%, and 4.2% net decrease in office-using jobs, respectively.
In addition to job growth data, there are other long-term positive signals for our target markets. While the near-term impacts from COVID-19 remain difficult to anticipate, data from our local markets continues to show encouraging news. Below is a summary of three of our ten target markets that we felt showed noteworthy signals for continued growth, despite COVID-19:
Raleigh, NC: As of 3Q20, per CBRE, Raleigh positively absorbed 22,482 SF of office space YTD. This positive activity amid COVID-19 is primarily due to the growth of its life sciences industry. The Research Triangle Park ("RTP"), located on the west side of Raleigh, is the largest research park in the country with approximately 600 life science companies including: GlaxoSmithKline, IQVIA, PPD, and Biogen. Since 2010, the number of life science employees in the Raleigh market increased 84% to 6,900 according to Cushman & Wakefield. This industry growth is reflected in the real estate market through numerous transactions and developments such as IQVIA signing a new lease for 322,384 SF in August 2020, Eli Lilly and CO. (NYSE: LLY) constructing a $474M pharmaceutical manufacturing facility creating 460 new jobs, BioAgilytix constructing a $61.5M expansion to their facility creating 878 new jobs, and Cellectis constructing a $69M immunotherapy manufacturing facility creating 200 new jobs. Furthermore, just announced before finalizing this quarterly report, "….Connecticut-based ApiJect Systems announced it will build a 185-acre campus, with a potential cost of $785 million, in RTP that will include a Gigafactory and up to 650 jobs….with scheduled delivery by Q1-2022. ApiJect, which makes an experimental disposable injection device, said the 1-million-square-foot campus will be capable of producing 3 billion single-dose prefilled injectors annually." Amazing news for the Raleigh market as it continues to harvest massive gains in the life-sciences arena.
Salt Lake City (SLC), UT: Due to its growing tech sector and highly active start-up market, SLC (dubbed "Silicon Slopes") is one of the best positioned markets to rebound from the effect of COVID-19. From 2016 to 2019, tech sector jobs in SLC grew at an average of 11.9% per year, and as of Q2-2020, tech sector jobs made up approximately 20.8% of the office-using jobs in the market according to CBRE's 2020 Tech 30. In addition, it is worth noting that Brigham Young University and Utah Valley University both maintain strong technology and entrepreneurship departments, and approximately 36.5% of all SLC residents earned a BA degree or higher. Access to a highly educated work force and the low cost of living leads companies like Adobe, Overstock.com, Qualtrics, eBay, Domo, and many other to create large footprints in the market. SLC has experienced 569,692 SF of positive net absorption YTD 2020, and while year-overyear total vacancy has increased from 9.4% to 11.9%, the average market rent has increased 1.3% year- 10 over-year per JLL. Even during a pandemic SLC is rebounding with positive absorption as of this past quarter. Impressive stats for a relatively young Secondary market.
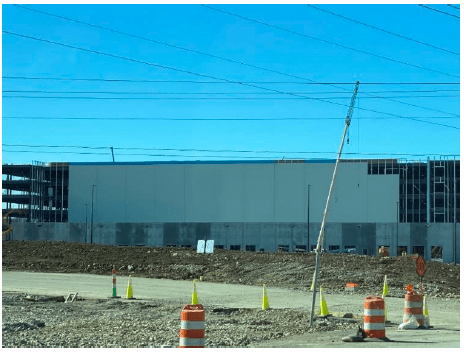 Nashville, TN: This market exploded over the last 10 years averaging 3.6% job growth per year, over 2x the national average per BLS. This growth is due to Nashville's abundance of the desirable attributes for employers and employees mentioned above: renowned music and cultural presence, centrally located, low cost of living, strong education institutions, and numerous outdoor recreation activities. Over the last few years, these attributes have persuaded large corporationsto stake a claim to what many call "NashVegas". The largest of these, Amazon (AMZ), has planted deep roots in Nashville leasing 1.25M SF of office space in two buildings under construction downtown. As you will see on this page, a photo from a recent site visit in late October to Griffin's Park 109, AMZ is also building a 5-story 3.6M SF, 96' clear height, fulfillment center, a mere 5 minutes from our Park 109 Development, in east Nashville to serve what will be a high-growth market. Other companies display similar conviction like Asurion relocating to a new 550,000 SF office building under construction in the CBD. Bridgestone occupies an entire 515,000 SF building downtown, and Alliance Bernstein occupies 220,000 SF new building as well in the CBD. With the University of Tennessee projecting Nashville's population will increase by over 500,000 people in the next 20 years, it doesn't appear this market's growth is poised to slow down any time soon.
Macro-Economic Conditions
Current conditions
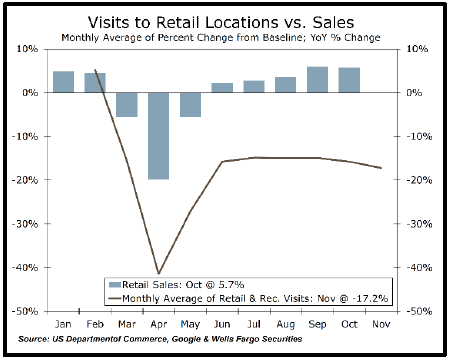 In our Market Thoughts last quarter, we highlighted the potential for a reverse square root shape to the U.S. economic recovery as one of two possibilities, the other being a K shape. The chart below which tracks the number of physical visits to retail and recreational locations certainly looks exactly like the reverse square root. This is consistent with the mobility data we have been tracking. Despite physical visits stabilizing at a level below the baseline before COVID, the bars in the chart indicate retail sales in total have shown more strength, with growth rates returning to preCOVID levels due in large part to surging online sales. Following the Global Financial Crisis (GFC), it took almost four years for nominal retail sales to recover to levels recorded prior to the recession. By comparison, it took four months for retail sales to return to February levels after tanking in April when most of the country was in lockdown. In the month of September 2020, total retail sales were 7% higher than they were in February. The second chart illustrates this stark contrast in the pace of retail sales recovery between the two downturns. All of this data predates the recent the resurgence of the virus, and unfortunately many areas of the US are now experiencing reimposed restrictions which will have a negative impact on retail sales and economic activity more broadly.
Because of the recent rise in confirmed COVID cases and hospitalizations, JPMorgan economics recently published a forecast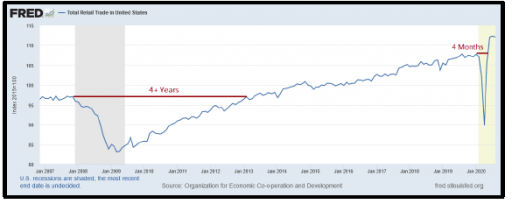 predicting a contraction in US economic output during Q1-2021 equating to 1% annually. Virtually all economic forecasters are predicting solid growth in Q4-2020 following the explosive growth in Q3. Bloomberg economics is also predicting a contraction in Q1 at a 0.5% annual rate.
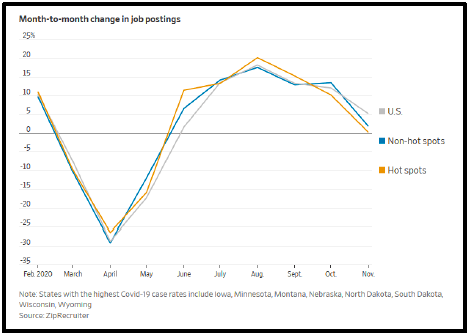
Recovery in the US labor market is certainly demonstrating signs of slowing. The Wall Street Journal ran a piece investigating state by state the link between the level of the virus spread and the conditions in that respective region's labor market conditions. The Journal reported that "regional data suggest it is not the level of Covid-19 infections but how state officials, businesses and consumers respond to the pandemic that appears to have the greater impact on the pace of the labor market's recovery in a state." The chart in the Journal's piece (shown nearby) demonstrates the absence of much meaningful difference in job postings between virus hot spots, non-hot spots and the U.S. as a whole. Notably, across all three the growth in job postings has declined and is approaching zero.
 Others measures of labor market health show a similar deceleration. Month to month aggregate job growth has been lower each month since June. Initial jobless claims have actually risen for the past two weeks, and the most recent week was the highest since early October.
A significant contributing factor to the decelerating labor market recovery is the impact either reimposed or continuing restrictions are having on U.S. small businesses. According to the consulting firm Bain & Company, as of 2017, 47% of total workers in the U.S. were employed at small businesses, and those firms employed 64% of workers in the restaurant industry and 79% of those in the personal services sector. In our report last quarter, we showed a chart illustrating that the ratio of permanent business closures to temporary business closures was rising as the COVID driven recession wore on. At the time, we highlighted some good news that the total number of business closures was declining. Unfortunately, as can be seen in the updated version of that chart found nearby, the trend in total closures reversed about the time of our report and has since moved higher, while the number of permanent closures now exceeds temporary closures. Both are undoubtedly discouraging trends.
To return to a more hopeful theme, the last month has seen excellent news regarding what by all accounts are highly effective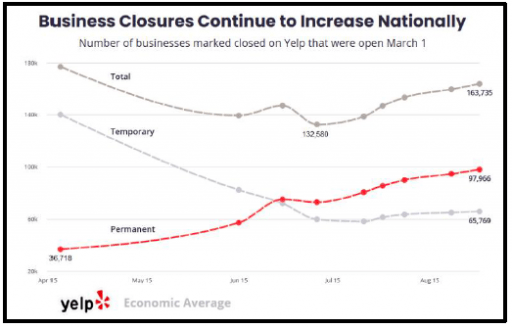 vaccines. Additionally, Operation Warp Speed was a smart move to fund the production of a number of these vaccines while they were still being tested in anticipation that one of more of them would be efficacious. This approach has resulted in a large inventory of vaccines already available, which will likely be deployed and used prior to year-end. The manufacturing capacity for the vaccines is also established and actively running. Both of these circumstances should lead to an acceleration of the date when the virus will be subdued, and restrictions can be lifted.
Also on a hopeful note, strength in manufacturing across the globe appears to be more durable than services and appears unlikely to weaken in the next couple of months, in part a result of the need to rebuild depleted inventories impacted by supply chain disruptions. More on that below.
China
In October we learned that Chinese GDP grew by 4.9% in Q3 (year-over-year), up from 3.2% in Q2. Given that performance, it is clear that China, having been the first major economy to shut down and then subsequently reopen parts of its economy because of COVID, is providing momentum to the global economic recovery. China employed an effective, some would say excessively forceful, virus containment policy. The result was an ability to quickly re-open key parts of the economy. In addition, significant monetary easing and fiscal stimulus are likely to result in positive growth for the year. Several economists are forecasting growth in excess of 2% for 2020, remarkable given that all other major economies are likely to have negative growth this year. According to a recent report from the IMF, Global GDP is expected to be negative 4.4% in 2020, although this decline is still better than the 5.2% drop the IMF projected in June. By comparison, global growth in 2008 during the GFC was negative 0.1%.
All may not be rosy for China moving forward. One of the biggest global effects of COVID-19 will be the rethinking of supply chains. Efficiency is being superseded by resilience as a priority. "Plus One" is the new buzz word for the strategy of moving away from dependence on China. If you Google "China Plus One strategy for supply chain" you get About 73,400,000 results. Wikipedia defines it as "China Plus One, also known simply as Plus One, is the business strategy to avoid investing only in China and diversify business into other countries. Developing from the overconcentration of business interests in China, it may be done for reasons of cost, safety, or long-term stability. It has also been described as a 'macro-level phenomenon'." According to Avison Young, "Governments and the private sector alike are looking to bolster the security of their critical supply chains, which generally means focusing closer to home. Regionalization is typically a core component of the strategy, shortening the links in the chain while creating networks that provide flexibility and parallel capacity in case of supplier failure. Risk management now rivals or even exceeds efficiency as the priority in decision-making – or as one commentator neatly summarizes it, 'just-in-time' is being replaced with 'just-in-case'."
It remains to be seen what the longer-term impact of this shift will be on the growth rate of the Chinese economy, but it is hard to imagine that it would not be meaningful.
Short-Term Impact of Fiscal Rescue
The fiscal stimulus undertaken by the U.S. in response to the COVID crisis has been unprecedented, and another large dose is probably on the way. Many are worried that the combined impact of massive fiscal and monetary stimulus will result in a significant rise in inflation. Is there inflation pressure building? Yes, there are indications, although modest, that inflation is trending up, but the increases are likely transitory. In addition to the inventory restocking impact we touch on in the next paragraph, we discuss another reason why we think these inflationary forces are transitory a few pages below under the heading Long Term Impact of More Debt.
For most of this century, relatively weak commodity prices and the outsourcing of labor intensive manufacturing to countries with 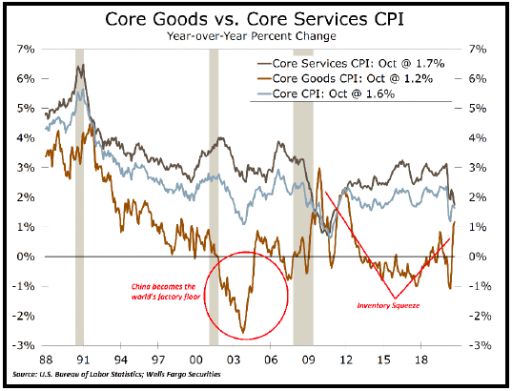 lower relative labor costs have kept inflation at bay and crimped pricing power for manufacturers and retailers with respect to goods, less so services given the high proportion of domestic labor in the service economy. The chart nearby shows this divergence of goods inflation compared to services inflation. As noted above, we have seen several months in a row of vigorous consumer spending, much of which has been on goods. Consumer goods inflation is clocking in at a higher rate than it has since 2012, although still low by historical comparison at only 1.2%. Total inflation continues to be relatively low notwithstanding the impact from the inventory squeeze. Wells Fargo economists “expect inflation to climb higher, but to remain below its pre-pandemic trend for quite some time, despite the modest price pressure from goods.” So, are massive government budget deficits inflationary? Especially if the central bank buys the debt issued to support the deficits? EPB Macro Research recently wrote a piece reminding of the simple but powerful economics axiom which can be used to determine the possible outcomes of government borrowing:
Domestic savings + inflows (trade deficit & foreign purchases of U.S. assets) = domestic investment + government borrowing.
Given this truism, there are only three outcomes from increases in government spending: larger trade deficits, a rise in private sector savings, or a decline in private investment. Of course, there can be some combination of the three. We have seen a substantial rise in savings during COVID as consumers had many fewer options for spending their money. But that circumstance only serves to highlight the tradeoff between savings and consumption. A rise in private savings begets a decline in consumption, which is a near term drag on growth as aggregate demand falls. Higher savings are good for long-term growth if they go towards more investment which raises productivity. The magnitude of the exploding deficit is staggering however, and there must be a significant change in one of the other factors as a result. EPB Marco summarizes it well: “In short, we need the foreign sector to continue yielding the United States their savings. Otherwise, we'll need to compensate for a significant increase in the demand for financial capital with much lower domestic consumption or domestic investment, both of which are bad for real GDP growth.”
What if the rest of the world stops buying U.S. sovereign debt? Quite a few pundits openly worry about this potentiality. To balance the equation, it would require either a huge increase in private savings (and corresponding huge decrease in consumption) or a major decline in private investment. EPB Macro again [emphasis ours]: “Either outcome is negative for GDP because we cannot circumvent the concept that borrowing is stealing future consumption for current consumption.” BTW – Increasing savings is the reverse, postponing current consumption in order to have more future consumption; something that the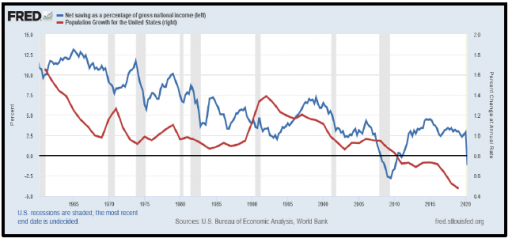 most recent generations of Americans are generally not familiar with! This problem is illustrated in the next chart, which shows net savings (private savings less government deficits) and population growth from 1960 to the present. Two things to note from this chart. First, net savings (blue line) as a percent of GDP (private savings less government deficits) as expected has turned negative with the passage of the CARES act on top of already large government deficits. Second, there is some correlation (0.55 coefficient) between the decline in population growth (red line) and the decline in net savings. While not highly correlated, the relationship between declining population growth rate and the declining savings rate is not surprising. As birth rates decline and the population ages in the U.S., fewer people are paying into government pensions and medical entitlements relative to the number of people making claims on those pension and medical entitlements plans. All else equal and absent changes in these entitlement plans, government deficits will rise inevitably leading to lower net savings.
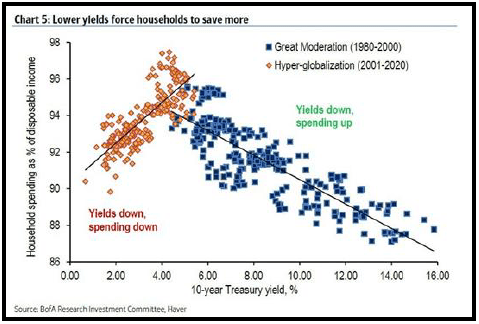 Interestingly, people seem to know both what is going on, and that the game may be rigged against them. The next chart illustrates that in the era of “hyper-globalization” during the first two decades of this century, private savings goes up in response to lower interest rates. This is a dramatic and pronounced inversion from the last two decades of the last century when consumption went up and savings went down as interest rates went down. Maybe there is hope for the current generations after all! However, if the pattern holds, lower consumption will be a headwind for economic growth once the short-term effects of COVID have passed, lowering inflation pressures an underpinning lower interest rates.
Are we at risk that foreigners will stop “yielding us their savings” (EPB Macro)? At the moment there is little evidence of global investors avoiding the sovereign debt of any of the overleveraged major economies, including the U.S. As of early November, the market value of sovereign debt with negative yields reached an all-time high of $17.05 trillion, eclipsing the record of $17.04 trillion set in August of 2019. $17.05 trillion represents approximately one-quarter of total world debt. China sold $4.7 billion worth of euro-denominated 5 to 15 year bonds recently at yields averaging negative 0.152%, the first time China has ever sold negative yielding debt. All the debt issued by the U.S. treasury is trading at yields above zero, albeit barely in some cases. And that could change, but we will save our assessment of whether the Fed will break the zero bound for a later date, as it is in our opinion not eminent over the next few quarters.
Can the Fed offset the absence of inbound foreign savings by purchasing even more treasury securities, and isn’t the combination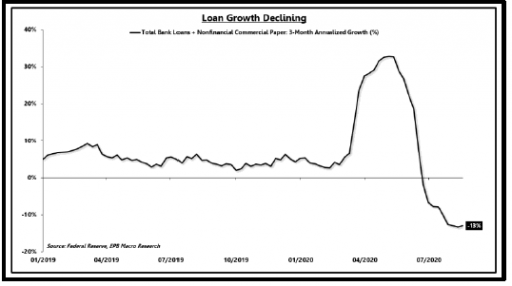 of the massive budget deficits and the Fed purchasing even more treasuries inflationary? In short, no and no. We covered this in-depth last quarter, so we won’t repeat the detail. In summary, aggregate demand in the economy does not rise as a result of the Fed purchasing a bond in exchange for an overnight deposit on its balance sheet (reserves). And in fact, money is not created by this exchange. Only if the banks are willing to lend the reserves to private borrowers who are willing to borrow the reserves will money be created. After the surge in borrowing associated with the PPP loans authorized in the CARES Act and the drawdown of corporate lines of credit, which have now largely been repaid, loan growth has turned negative, as predicted. See nearby chart. The only way for the Fed to create money without the expansion of bank lending is for the Fed to issue money directly to the private economy (truly “printing” money) or to absorb losses on defaulting assets, both of which are illegal under the Federal Reserve Act. Thankfully!! But that could change, and we discuss the implications in the next section.
There is one more element of a fiscal blowout that bears mentioning. A significant amount of economic research since the GFC has taken a fresh look at the government spending multiplier. The idea of a government spending multiplier, a dollar spent by government yields more than a dollar of economic output, was first made famous by Keynes, but over the intervening ~90 years, its veracity has been called into question. In Keynes defense, he had never seen a welfare state like the ones we have now constructed around the globe, including in the U.S. While difficult to draw firm conclusions, there is a consensus in recent research that the type of government spending is a critical determinant. Social welfare transfer payments are now generally believed to have a negative multiplier, whereas spending on infrastructure, research or training and education are much more likely to have a positive multiplier. As such, pure transfer payments such as a universal income scheme would almost certainly have a negative multiplier and thus be a drag on GDP growth. There is also consensus that at high government debt levels, all government spending is likely to incur a negative multiplier, because it reduces private spending by more than the amount of government spending.
Long-Term Impact of More Debt
The explosion of the Federal fisc has led to a huge increase and focus amongst the economic glitterati on the excessive levels of debt around the globe. Our readers know we have spent perhaps too much time 17 obsessing on that topic, but we can’t help incorporating it as briefly as possible into this quarter’s discussion since it is the ultimate determinant of where we are headed
The increase in deficit funded government spending that all large economy governments are undertaking as they try to fend off 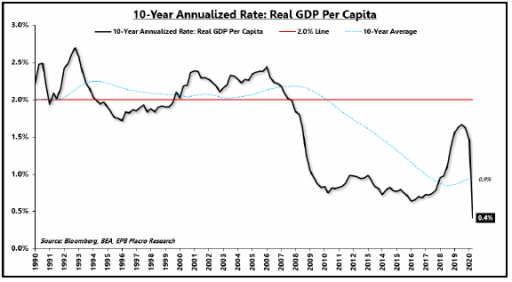 COVID is the only politically feasible path, but while it improves short-term economic conditions, over the long run mounting debt loads lower a nation’s standard of living, particularly amongst those citizens below the median income level. As such, income inequality rises. This problem is illustrated in the next chart which shows real GDP per capita breaking trend to the downside at the time of the GFC when the U.S. federal and corporate debt loads began to increase significantly. The chart again comes from EPB Macro and is accompanied by a great summary: “Over the long-run, growth is determined by population growth and productivity growth. Population growth is hard to alter. Productivity growth is most effectively improved by investment, which becomes challenging at lower levels (or negative) of net national savings.”
“Yes, there are (four) paths you can go by, but in the long run…..there's still time to change the road you're on” (maybe) …….Page Plant (Griffin)
We will spare you the graph of how bad the debt problem is. You have seen it before. Economists believe there are four ways to get rid of an overhang of bad debt. One: Austerity, wherein the private economy and the government attempt to reduce consumption and increase net savings. At levels sufficient to fix the debt problem, this approach has always resulted in severe economic outcomes, most recently Greece. Two: The one preached by most economists over the past two decades is to grow out of it, through stronger real economic growth. This is extremely difficult to actually accomplish because the debt overhang itself significantly impairs growth potential, and as discussed above, both population growth and productivity growth are at multi-generation lows. Three: Inflate your way out. Pay back the debt with currency worth much less than on the day the debt was issued. A significant number of economists suggest this as the best way out, and the Fed clearly agrees since it is trying VERY HARD to create inflation……..but as we know with very little success. Lastly Four: Restructuring the debt and/or allowing massive defaults. This last path has been followed by smaller countries (think South America) for years, to the suffering of and impoverishment of most of their citizens.
A friend turned us on to a podcast by Grant Williams called The End Game. We highly recommend it. It is full of ideas from prominent folks about how this will all end. One common theme shared by those interviewed is that the current situation could grind on for a long time before reaching “the end game.” 18 We concur that a long grind is in store before reaching any kind of paradigm shift. During the long grind, interest rates will remain low to very low. Witness Japan for the past two decades. We last remarked upon the debt trap faced by Japan in our Market Thoughts of Q4-2018, and things have only gotten worse for Japan since. The most recent data indicate Japan has returned to an outright deflationary cycle with -0.7% year-over-year inflation in October, the worst read since March 2011. Is it possible the U.S. will be stuck in a similar spot for the next TWO DECADES? Yes. Likely? No.
We have two suggestions about what will bring a more rapid end to the trap in the West. One serious, and one a bit humorous.
First the serious one. Following the path we are on inevitably increases income inequality as the prices of assets, which are generally held by the more affluent, inflate and real wage growth stagnates even further. We are already seeing political demands, and even some small experimental efforts, to provide a universal income. If political pressure grows to the point where congress amends the Federal Reserve Act to allow the Fed to be coerced into directly funding some type of universal income (truly “printing” money), the resulting inflation spiral and collapse of the bond market that will follow would be the final chapter prior to a new paradigm. Another similar thing could happen as a result of political pressure over climate change policy. You laugh………surely not………..
For those readers who are believers in economic freedom, here is some scary stuff. In a posting in The Grumpy Economist (aptly named) on October 21, 2020 the author recants a recent speech by European Central Bank (ECB) Executive Board Member Isabel Schnabel’s. She recommends:
"First, as prudential supervisor, we have an obligation to protect the safety and soundness of the banking sector. This includes making sure that banks properly assess the risks from carbon-intensive exposures…"
She then obliquely says the ECB should (literally) print money directly to fund green projects:
"reassessing the benchmark allocation of our private asset purchase programmes. In the presence of market failures, …the market by itself is not achieving efficient outcomes."
Borderline absurd to think that credit exposure to carbon intensive companies is inherently different in ways that current risk assessment measures can’t capture. But of course, it is about political coercion, not credit risk. The trigger signaling the “end game” is when this political coercion manifests itself in the form of a mandate creep for central banks to “solve” political issues by truly printing money and handing it to politically favored constituents. Game over.
Now the humorous one, to end on a lighter note. If the Fed successfully embarks upon yield curve management and creates so much liquidity that the risk premium for all assets goes to zero, this could compress volatility and reduce trading volumes to the point where there are no bonuses on Wall Street. The end of financialization! If that happens, then things begin to change. Elites will demand it, especially when the money going from Wall Street to the pockets of politicians dries up.