Our Market Thoughts this quarter are somewhat lengthy as there is so much to talk about amidst the upheaval of COVID, the recession and gyrating markets. For those readers with limited time who want to go directly to a specific topic we will cover or simply get a quick take, we are adding this quarter a feature that combines a table of contents and summary, as follows.
- Our Fund Updates can be found at the top of the next page.
- In Real Estate Market Conditions, we discuss our belief that small bay industrial real estate is a compelling area of investment now, given the secular trend of rapidly expanding e-commerce and the relatively low amount of new supply in this specific industrial product type. Page 2 (Disclosure: We are "talking our book" just a bit.)
- Our Macro-Economic Conditions analysis begins on page 6 with the continuing debate on the "Shape" of the Recovery. No longer are we talking about a "V" shape or a "U" shape but much more likely an inverted square root sign

or maybe an even more descriptive letter

- Economic analysis continues with Follow the Money (The Fed and Bank Lending) on page 10. The Fed appears to be on the scene and hanging out at the party, but is it still truly loosening monetary conditions in a way that contributes to economic growth? Stability yes, growth probably not.
- And as a bonus this quarter we have Real Estate Market Conditions - Redux highlighting a quick look at the negative impact on rental rates in large metros from COVID and the state of the CMBS market on page 12.
We are seeking answers or at least trying to make a gallant effort to understand the near and long term impacts of the current pandemic as they relate to our investment objectives and strategic business plans. To do so we try to peel back layers of data to help us make sound investment decisions going forward. In this report, we will highlight some insights from our real estate lens, for better or for worse, embracing e- commerce, the virtual marketplace, and the "gig-economy" which has ballooned to unprecedented numbers over the past decade, and specifically how we can continue to capitalize on an industrial investment strategy during these unprecedented times.
In our next quarterly report, once the Q2-2020 data is finalized and scrubbed, we will provide some insights on the pandemic impact on commercial real estate (CRE) within our target markets as well as the possibility of a few other key markets we are exploring to fold in as opportunities to pursue.
As in past reports, we have tasked the TEAM to assist in compiling data and asked our self-confessed rhythmical writer, Wilson Prioleau, to provide his prose in this report. He, in large part, has the baton on providing our readers some insightful data and commentary within the Real Estate Market Conditions update.
Fund Updates
As mentioned last quarter, Fund II & Fund III assets are continuing to perform well despite the pandemic. Tenants across our portfolio have been resilient thus far, and rent deferrals have been limited. With a total tenant base of over 315+ tenants across 7 metros, as of the end July we've incurred only two tenant losses (less than 0.41% of the portfolio), and ten tenants have executed rent deferral amendments since
this pandemic began which equates to approximately 0.55%+/- of total annual portfolio rent received.
Fund II: Please refer to the Managers Letter later in this report for additional specifics on the two remaining assets in Fund II.
Fund III: As mentioned in our last report, we are proceeding with the Callis Road Industrial Project in Nashville, TN. This speculative development project totals 375,000 square feet just east of Nashville off Interstate 40. In early July we completed the land purchase totaling 32.8 acres, and since then we've successfully completed a re-plat of the two-parcel assemblage, continued to refine our development budget, selected a general contractor, and we are finalizing the remaining equity raise. Further, the TEAM completed a strong effort to secure debt financing more favorable than our initial underwritten terms. We are excited to move dirt in the coming months, and by our next report we should have shovels in the ground assuming all goes as planned!
For more information on Fund III assets please refer to the Managers Letter later in this report.
Real Estate Market Conditions
While the anti-social millennial, meme-reliant Gen Z'er, and grumpy Boomer all attempt to run their daily errands amidst the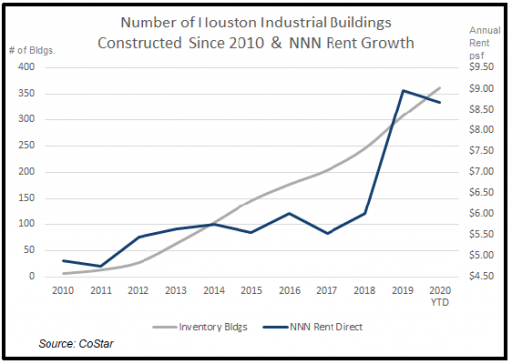 embrace of a pandemic, it makes complete sense for them to shift their spending to e-commerce's "same day shipping", "two-day shipping", and home delivery guarantees. Consumers adapt to current trends, and as they do, it becomes increasingly important for the consumer to receive reliable delivery of their goods at their front doors. It's up to the facilitators of the orders to either own or rent distribution space to follow through on delivery guarantees. Amazon cannot promise two-day shipping if it doesn't have a distribution center within driving distance or a contract with a logistics provider who does. Accordingly, these distribution centers have proliferated. For example, CoStar indicates that total inventory of Houston Class A industrial projects of all types constructed just since 2010 has grown to approximately 80 million square feet encompassing 360+ buildings, corresponding with the growth in e-commerce and home delivery demand. Consequently, as seen in the chart on the previous page, industrial asking rents have grown from $4.80/sf NNN to $8.60/sf NNN as landlords capitalize on ownership of product in such high demanded.
As the volume of e-commerce grows, the demand for industrial/logistics properties grows correspondingly. During the pandemic, many people have second guessed the need to run basic errands considering the potential health risk and have therefore sought alternative methods to fulfill their daily, weekly, and monthly consumption of goods. Accelerated by COVID, we believe this trend will very likely continue post-pandemic, driving us to redouble efforts to increase Griffin Partners' industrial portfolio weighting.
As investors, we strive to look beneath the surface theme of continued growth in e-commerce demand and find patterns which allow us to draw upon executable investment strategies, specifically tied to industrial development or acquisitions. E-commerce will continue to create tenant demand for both large bulk distribution logistics centers and smaller last-mile fulfillment centers. We believe there is a yield premium available when acquiring or developing smaller industrial projects that have infill distribution characteristics or outer urban locations within a market's "path of growth." A number of submarkets in our target metros are under served by product suitable for small to mid-size tenants below +/-100,000 sf.
Griffin Partners' ten target markets demonstrate key attributes for continuing to execute this industrial strategy including higher barriers to entry, intrinsic tenant demand, strong and continuingly favorable demographic trends, and thus, in the mid to long term, higher rental rates with lower exit cap rates resulting from strong institutional capital flows. As in office investing, we firmly believe in purchasing existing, or developing, well located industrial assets that have sustainable demand characteristics which will attract institutional liquidity.
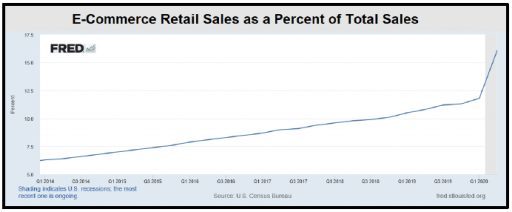 E-Commerce continues its record-breaking bull market and continually takes market-share from its brick- and-mortar cousins on Main Street. According to a recent US Census Bureau report, "the estimate of U.S. retail e- commerce sales for the first quarter of 2020, adjusted for seasonal variation, but not for price changes, was $160.3 billion, an increase of 2.4 % from the fourth quarter of 2019. Conversely, total retail sales for the first quarter of 2020 were estimated at $1,364 billion, a decrease of 1.3% from the fourth quarter of 2019. The first quarter 2020 e-commerce estimate increased 14.8% from the first quarter of 2019 while total retail sales increased 2.1% in the same period. E-commerce sales in the first quarter of 2020 accounted for 11.8% of total sales." The dramatic acceleration of e-commerce as a percent of total retail sales resulting from the current pandemic is illustrated in the chart on the previous page.
A recent CBRE report suggests an increase in e-commerce activity will drive demand and development of "high-quality, first generation Class-A light industrial warehouse spaces of less than 120,000 sq. ft." In the business, we often call this product type "small bay" industrial. The CBRE report further indicates that the demand for small bay product will continue to accelerate as retailers and third-party logistics (3PL) companies sprint to achieve e-commerce's holy grail of "same-day delivery." The report goes on to say "these properties [sub 120,000 SF warehouses] have seen rents rise by 30% in the past five years, whereas big-box rents rose by 15%. Considering that space is very limited in the smaller-size segment, rent growth is expected to continue over the next 12 months." CBRE foresees increased rent growth and remains bullish on the light industrial small-bay sector. This anticipated trend towards rising rents for small bay industrial falls in line with Griffin Partners' strategic focus on small bay, last-mile, light-industrial assets.
Furthermore, JLL forecasts additional tailwinds driving industrial demand in the global giant's latest position paper. JLL President of Industrial Services, Craig Meyer, says: "We have historically attributed as much as 35% of industrial leasing to e-commerce. Currently, as much as 50% of our leasing activity can be attributed to e-commerce related operations." In addition, JLL's report references similar Census Bureau information indicating e-commerce's $602 billion in total sales last year, while going further and forecasting that annual e-commerce sales could reach as high as $1.5 trillion by 2025.
These dramatic statistics highlight the growing necessity of warehousing, logistics, and light industrial space. In a quote from JLL's paper, Chris Caton, Head of Global Strategy & Analytics for Prologis, the largest owner, operator, and developer of logistics real estate in the world, says: "E-fulfillment is among the most intensive uses of logistics real estate. Prologis estimates these customers will require 1.2 million square feet of distribution space for each $1 billion in sales, which means e-commerce requires three times the space as traditional through-put distribution." JLL affirms this ratio in its own independent analysis and says: "Given our projections for e-commerce growth through 2025 (see nearby chart), an additional $900 billion in sales would equate to a demand for over 1 billion square feet of industrial real estate by 2025." 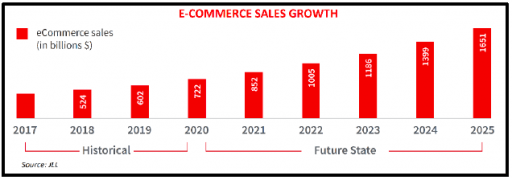 Macquarie, a large global real estate investor, also affirms that 3:1 ratio as indicated in research from early 2019 indicating "e-commerce generally requires three times the amount of distribution space than that of traditional retail users because customers are seeking a greater variety of goods, and speed, and delivery." Strong demand metrics will support higher rents and more development.
Momentum across our ten target markets for small bay industrial is indicative of a critical need from tenants for this product type, and is it is propelling a significant demand for increased ownership of this product amongst institutional and private equity capital investors seeking to capture higher yields compared to the ultra-hot big-box credit tenant industrial sector.
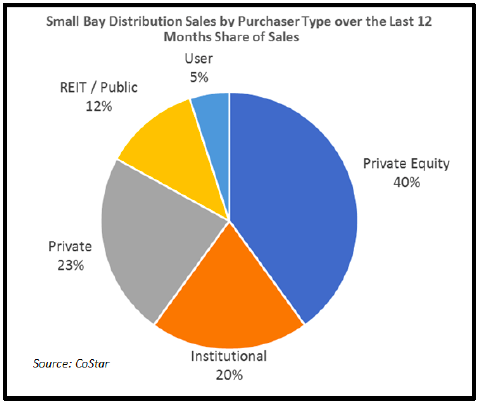 Some evidence of this important capital flow trend can be seen in the acquisition activity of institutional and private equity investors in the past twelve months. See the nearby chart which breaks down by purchaser type the trailing twelve-month acquisition market share for industrial assets ranging in size between 50,000 and 250,000 square feet in the ten markets targeted by Griffin Partners. The major public REITs tend to be acquiring the larger, credit tenant backed, big-box bulk distribution warehouses, garnering a 24% share in that larger box category versus a 12% share of small bay seen in the chart. However, nimbler private equity sources poured money into the small-bay industrial market, increasing their relative volume by 66% and boosting their market share to 40% of acquisitions, up from an average 24% of the available deal flow of small bay warehouses over the last 36 months. Private equity, often backed by pension funds and large family offices, tends to lead the pack as opposed to follow it with respect to CRE capital flows. We think this trend will continue because the more agile private equity firms can chase investments with more risk and value add potential which larger institutional investors, comprised of large non-REIT public companies and open ended mega fund asset managers, struggle to pursue due to their generally more conservative investment mandates and liquidity needs.
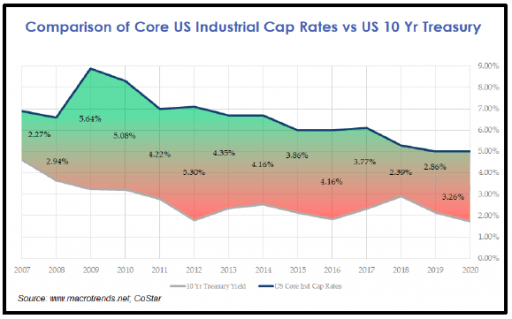
The tide of capital moving towards industrial assets is compressing cap rates relative to US Treasuries (see nearby chart) and relative to other major real estate product types. However, industrial assets generally have a lower capital drag (capital required to be reinvested to maintain occupancy) than the other three major product types (office, multi-family and retail), so relative cap rates don't tell the whole story, and total risk adjusted returns for industrial assets are comparable to the other major product types.
In previous reports we have provided data demonstrating the record amounts of dry powder 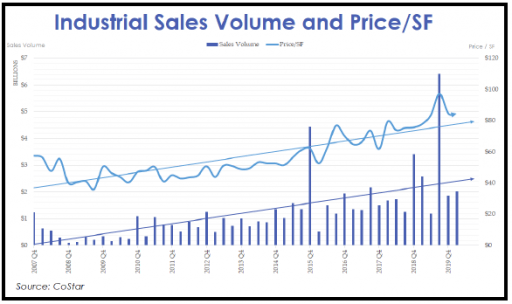 sitting on the sidelines resulting from major investors increasing their portfolio allocations to alternative investments such as real estate. COVID appears to have accelerate that trend, like it has with so many other trends.
The broad capital formation behind industrial investment strategies is supporting the long-term trend of rising transaction volumes, increasing prices per square foot, and declining cap rates, especially on on core product. The nearby chart displays the long-term trend for pricing and transaction volumes.
The market is highly competitive. Both legacy participants and newcomers are witnessing the same strong trends. We don't expect our push to participate to be easy, nevertheless, we will continue the hunt.
Macro-Economic Conditions
In last quarter's report, we spent a bit of time discussing the expected SHAPE OF THE RECOVERY, expressing some skepticism 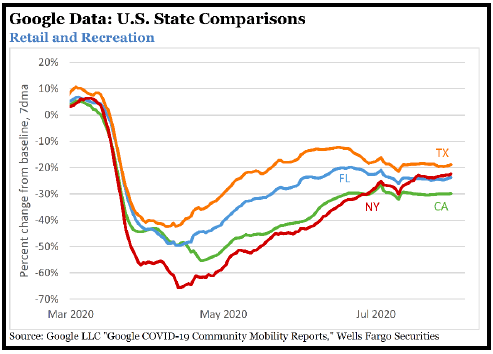 regarding the optimistic forecasts for a full "V" shaped recovery and indicating the likely trajectory would be closer to a "U" shape and predicting U.S. economic activity would not be restored to pre-COVID levels until the second half of 2021. Well, COVID and the policy responses to it continue to surprise. Some of those surprises are positive, and more than a few are less optimistic. As we go to print, the recovery shape looks more like a backwards square root sign, as the U.S. economy starts to reopen and responds to the unprecedented Federal Reserve liquidity programs and federal government stimulus spending. The nearby chart illustrates this reverse square root form. The chart is from mobility and location data gathered by Google from millions of people's mobile phones. Yes, Big Brother is tracking you! Of course, this data from the four most populous U.S. states, tracking trips to a retail or recreational location, would not capture a big chunk of online retail sales substituting for trips to the store. As we highlight in the Real Estate Market Conditions above, that substitution is significant and growing rapidly. The chart does however portray a clear trend of increased activity off the deep trough of negative 50% on average, but activity has clearly plateaued at a level down roughly 25% from its pre-COVID level.
Another chart that displays the reverse square root shape, albeit with a less pronounced plateau, is the Weekly Economic Index 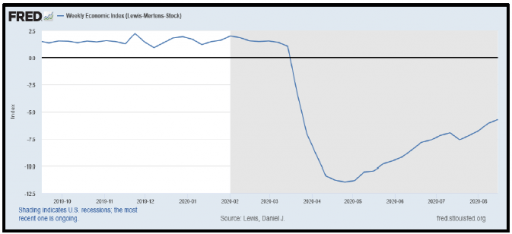 (WEI), an index of real economic activity using timely and relevant high-frequency data. It is compiled and published by the Federal Reserve Bank of New York. It tracks consumer behavior, the labor market, and production by constructing a composite of 10 indicators including store sales, a daily consumer confidence index, unemployment claims, tax withholdings, rail traffic, temp staffing data, steel production, wholesale fuel sales and average US electricity loads. All series are represented as year-over-year percentage changes, and the composite index "is scaled to the four-quarter GDP growth rate; for example, if the WEI reads -2% and the current level of the WEI persists for an entire quarter, one would expect, on average, GDP that quarter to be 2 percent lower than a year previously."
 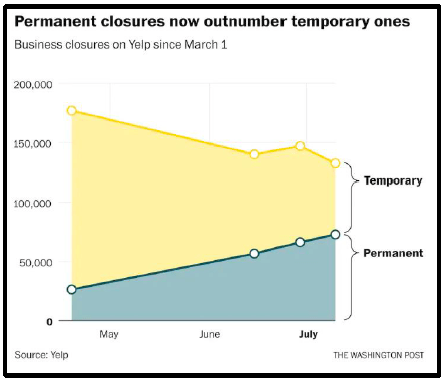 The index was stable at around a 2% annual growth rate then plummeted in mid-March. The National Bureau of Economic Research (NBER), official arbiter of dating economic cycles, has officially pinned the recession start date as February 2020, so the WEI trailed the recession onset by four or five weeks. We will be tracking the WEI to see if the plateau becomes more pronounced in late August, which would line up with the Google mobility data above.
One element of this recession that will clearly prevent the economy from completing a "V" or "U" shaped recovery is the permanent closure of tens of thousands of small businesses. In mid-July, 55% of the nearly 200,000 businesses connected to the online reservation and user review service Yelp, have permanently closed. That is roughly 132,500 permanent business closures on Yelp which are now classified as permanent. In addition to restaurants, Yelp's community of businesses includes broad spectrum of other consumer-facing businesses like dentists, doctors, hair dressers, home repair services, etc. To compile the closure statistics, the firm only counts closures that have been confirmed by Yelp's user operations team or reported directly by the business' owner. As the chart indicates, the magnitude of permanent closures is mounting, whereas temporary closures are declining. Thankfully, the total is falling as well. It is possible the permanent closures could see a spike because the Paycheck Protection Program (PPP) funds were designed to carry small businesses through June or July, depending on when their PPP loan was funded. Regardless of whether we see a spike in the closure data soon, it is evident that many businesses closed for what was expected to be a short period, then determined not to reopen.
So, if you are the owner of one of those permanently closed businesses, your view of the shape of the recovery is certainly not a "V", or a "U" or probably not even a reverse square root sign. Several thought leaders we track both in economics and in real estate are now talking about a "K" shaped recovery, where there is a divergence in the recovery between the "haves" and the "have nots." The lower leg of the "K", the have nots (dotted red line in the figure nearby), are those permanently displaced by the recession. The closed business above. 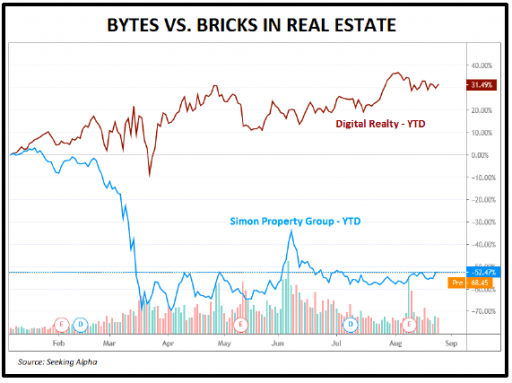 Or, the tens of thousands of airline workers who are soon to be laid off when government CARES Act money directed to airlines runs out, and the airlines must adjust to the "new normal." While permanent displacement is a feature of all recessions, it is clear that this one will have many more businesses and people falling into that category compared to every other post-war recession. Other examples of the haves and have nots: essential vs. non-essential, tech vs. (carbon) energy, industrial vs. retail real estate. Look at this chart comparing the YTD stock prices of Digital Realty Trust (DLR), a data center owner operator, to Simon Property Group (SPG), an owner operator of shopping malls. UP 31% vs. down 52%. Wow!
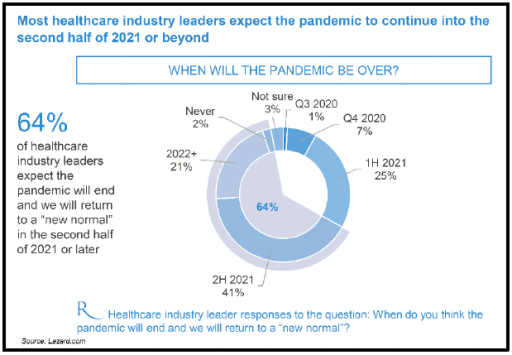
What is the new normal and how long until we get there? Virtually all economists agree the recovery will follow the path of the pandemic. Either a vaccine(s), very efficacious therapeutics or both must be developed and become widely available. There are widely divergent views on a realistic timeframe for a vaccine. Optimists think year-end 2020 will greet us with the good news of a vaccine, pessimists say never. Lazard recently conducted a survey of healthcare industry leaders. In the survey, 73% polled think a vaccine will not be widely available until the second half of 2021. There has been good news on the vaccine front recently, but the science is always difficult and the odds for all drug development are stacked against. From The Real Economy Blog: According to Joseph A. DiMasi, director of economic analysis at Tufts Center for the Study of Drug Development, only an estimated 12% of new drugs entering clinical development are approved for marketing. The limited number of novel drugs that make it to phase III clinical trials face a 54% failure rate, with 57% of those resulting from a lack of efficacy, according to a 2016 study published in the Journal of the American Medical Association.
 Also from The Real Economy Blog: "The unfortunate reality is that COVID-19 has been so devastating to the real economy, our society, and the national psyche, that we as a collective group have yet to consider a reality that may not include a near- term vaccine and the substantial challenges associated with an mpaired economy."
Back to the Lazard survey of healthcare industry leaders, the nearby chart shows the responses to the survey question: "When do
you think the pandemic will end and we will return to a "new normal?" 64% of survey respondents answered the 2nd half of 2021 or beyond. That lines up with our initial guess in last quarter's report of Q3- 2021 to return to pre-COVID GDP. And, that is likely still too optimistic for those on the lower leg of the "K."
Things look better in China, which so far is closer to a "V", if you can believe the stats. And thanks to a remarkable political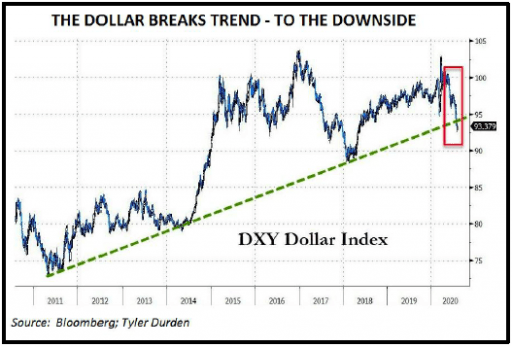 evolution towards more integration, Europe is expected by many to outperform the U.S. for the first time in half a generation. It really is a big deal that Germany has reversed course and not only agreed to expansionary fiscal policies but also played the key role in engineering the first ever EU issuance of common debt on a large scale. This debt mutualization will reverse the drift towards disintegration (Brexit et. al.) and set a course along a slow path towards integration. Thanks in part to now reversed relatively austere fiscal postures after the initial recovery from the GFC, the EU has done a better job of deleveraging, a factor that when coupled with the anticipated economic outperformance of Europe, has contributed to the recent decline in the dollar.
Perhaps the most significant global macro event to happen in the past 90 days is the fall of the dollar. Is it an inflationary signal, or is the world simply repricing everything downwards, and since more things are priced in dollars than any other currency, fewer dollars are needed? Commodities and precious metals prices, until just recently, would indicate inflation perhaps. We have not changed our view that the long- term inflation outlook is benign at worst, and perhaps weighted towards the risk of deflation. Part of the long-term answer is the dollar's reserve currency status. To what degree is the dollar the world's reserve currency? Per Eastdil Secured: "According to an analysis done by the IMF and Bloomberg, the Dollar's stance as the World's reserve currency remains solid as of the end of Q1 - with 62% of global reserves held in U.S. dollars, 20% in Euros, 5.7% in Yen, 4.4% in British Pounds, and 2.0% in Chinese Yuan."
There are three possible reasons the dollar breaks trend to the downside in the near-term: 1) EU makes major move toward a fiscal union [check], 2) China does better than the western democracies at containing and adapting to the virus [check], and 3) rising political uncertainty in the U.S. [check!!].
Recently, foreign purchase of U.S. Treasury issuances has been declining, but with the dollar and U.S. interest rates both lower, the cost for foreign purchasers to hedge dollar denominated investments against their own currencies has declined considerably. This should contribute to more foreign demand and lower interest rates.
Follow the Money (The Fed and Bank Lending)
Last quarter we droned on about money multipliers, velocity and how in our opinion the highly stimulatory monetary policy 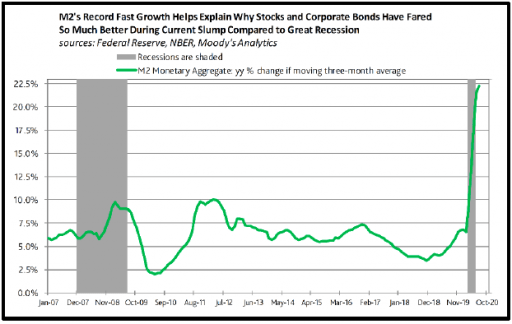 would calm markets but not necessarily stimulate the economy and spark inflation since most of the money would end up eventually back on the liability side of the Fed’s balance sheet. The M2 stats through July are even more eye popping that those we were looking at last quarter. The moving 13-
week average rate of growth for the M2 monetary aggregate prior to the start of the COVID- 19 recession was up by 6.7% year-over-year (YoY). By the end of July 2020, M2’s moving 13-week average was up by a record-high 22.6% from a year earlier. See chart. By comparison, the YoY growth rate for M2’s moving 13-week average barely rose from the 5.3% just prior to the December 2007 start of the Great Recession to 5.9% five- months later, and at the height of monetary stimulus during the Great Recession, the YoY increase by M2’s moving 13-week average peaked at the 9.8%. The Fed has achieved hyper speed! Elon might be jealous.....
Risk ON! – Corporate debt issuance is blowing through past record levels. As Moody’s points out: “What makes 2020’s record-breaking pace for US$-denominated high-yield bond issuance nothing less than remarkable is how it has occurred amid both a recession and a steep, unfinished ascent by the U.S. high- yield default rate. From December 2019’s 4.3%, the high-yield default rate has since climbed to July 2020’s 8.4% and is expected to eventually crest at February 2021’s 12.1%.” “Nevertheless...... Bloomberg/Barclays high-yield bond spread has narrowed from the March 23rd cycle high of 1,100 basis points to a recent 480 bp.” Nuts.
Excess liquidity is seeking any home it can find and distorting asset prices as it does so. One piece of evidence, “green bonds.” We generally support rational sustainability goals but must conceded we are a bit confused by the “green bond” craze emerging in financial markets, including real estate. CoStar: “Real estate companies and major space users have issued or plan to issue more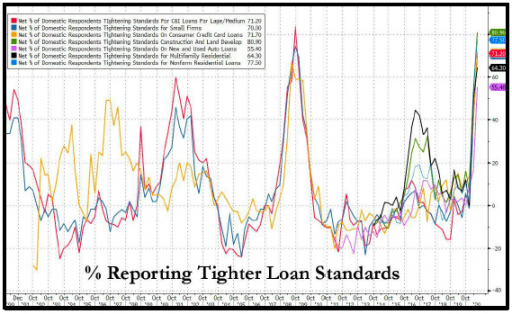 than $3 billion in bonds to finance environmental investments and sustainable property improvements. Prologis’ $750 million offering is the industrial property real estate investment trust’s fourth such offering this year and 10th overall. U.S. green-bond offerings in the second half of last year were oversubscribed by 2.7 times compared to 1.9 times for nongreen bonds. In addition, new green bonds achieved better pricing, on average, than their nongreen equivalents.” “.....most of the proceeds from the green-bond offerings are generally targeted for nonspecific green projects.” Please! Funds are fungible, so what gives? Virtue signaling probably, because the same company issuing non-green bonds pays a higher rate. Hard to explain any other way.
Banks are not lending, post PPP. This was a key issue we highlighted last quarter. If borrowers don’t borrow and banks don’t lend, then all the money eventually ends up back at the Fed in the form of excess reserves, and there is virtually zero net simulative effect on the productive economy. As can be seen in the chart above, banks are tightening loan standards, which is typical during a recession. While borrowers could still be borrowing even with tighter standards, the deceleration in loan growth, particularly for commercial and industrial loans AFTER the PPP loans were all originated tells the story.
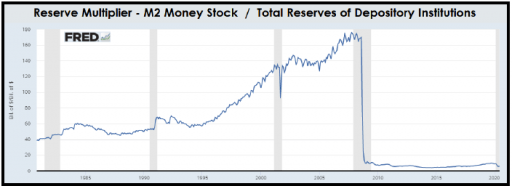 But if you want to see the “mic drop” chart, take a look at the next one. Other than the charts showing the explosion of unemployment claims, and maybe the M2 growth rate chart above, we can’t remember seeing another chart that looks this dramatic. Bear with us, it is a bit wonky. The Reserve Multiplier is the relationship between M2 and total bank reserves. The chart is the ratio of the M2 Money Stock divided by the total reserves of all depository institutions. In short, the higher the number, the more banks are converting reserves into loans, truly expanding the productive economy. The lower the number, the more reserves are piling up on the liability side of the Fed’s balance sheet, neutralizing monetary stimulus. Look what happens during the GFC. The ratio collapses, and never attempts to build a path back to higher levels which were common for the prior thirty years. The Fed’s influence on economic growth is very limited with the Reserve Multiplier down at these low levels, particularly with lower values for the Money Multiplier which we highlighted in last quarter’s report.
Real Estate Market Conditions-Redux
Rising unemployment and the diaspora of city workers fleeing to their remote location of choice from which to work are having a now measurable impact on residential rental demand and therefore rent rates. 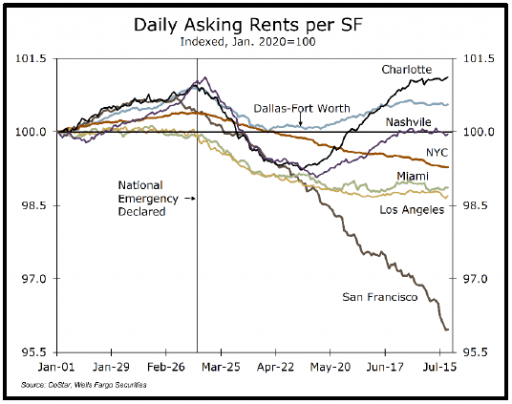 Also, many of the lost jobs since the recession started are among hourly wage earners who are more often renters than homeowners. The decade long boom in new apartment construction especially in dense urban areas has also led to a dramatic rise in apartment supply. The collision of these forces is starting to show up in falling rents. According to data from CoStar, compiled by Wells Fargo Securities, the “trend is most evident in the relatively high-cost markets of San Francisco, New York City and Los Angeles. Rents have been more buoyant in Dallas-Fort Worth, Charlotte and Nashville [all three Griffin Partners’ target markets!]. Even before the public health crisis, these areas had long been beneficiaries of residents and businesses fleeing high cost areas, a trend which is now supporting rents.” The chart nearby illustrates this divergence in rent growth. Notably, San Francisco is down almost 5% in 4 months. Anecdotally, our real estate investment banking friends tell us that construction loans for new multi-family projects are very hard to come by for the first time in over a decade.
Commercial Mortgage-backed Securities (CMBS) have experienced a significant rise in defaults since the onset of COVID. While there is optimism in some areas of the market, accommodation (hotel/motel) mortgages have witnessed delinquency rates soar to over 24%. During the teeth of the lockdown in April, average revenues per room plunged to $16 per night—an 84% drop. Retail 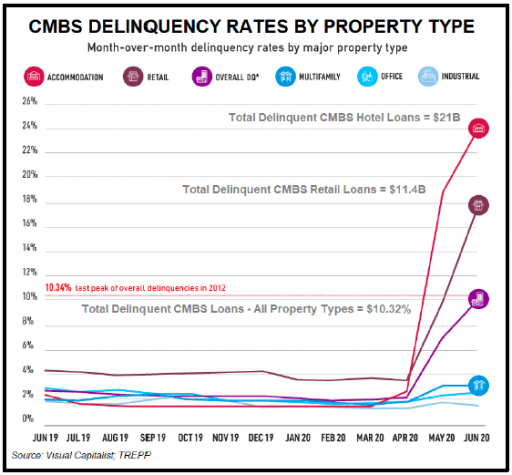 properties are also struggling as almost 20% are delinquent. From January-June 2020, at least 15 major retailers have filed for bankruptcy, and over $20 billion in CMBS loans have exposure to flailing chains such as JCPenney, Neiman Marcus, and Macy’s. Conversely, industrial property CMBS mortgages have remained stable, hovering close to their January levels. Not surprising given the dynamics we articulated in the early pages of this report. The nearby chart from the Visual Capitalist is a concise depiction of the current state of the CMBS market. Visual Capitalist: “For multifamily and office buildings, Washington’s stimulus packages have helped renters to continue making payments thus far. Still, as the government considers ending stimulus packages in the near future, a lack of relief funding could spell trouble. As effects reverberate, properties could eventually fall into foreclosure. At the same time, institutional investors who own these types of securities, which include pensions, could begin seeing steep losses. That said, the Federal Reserve has set up mechanisms to purchase CMBS loans with the highest credit quality. This is designed to inject liquidity into the mortgage market, while also financing small and mid-sized properties that house small businesses.” Risk ON!