The last 60 days has been quite a ride, and it feels more like a year for many of us. We have been flooded daily with news about COVID-19 and its effects on everything from toilet paper to a barrel of oil! As we have highlighted within the last few quarterly reports, there were several signs of a slowing economy before the pandemic, and what has occurred in the last two months has pushed us into choppy waters in the capital markets and a recessionary macroeconomic environment. In this report, we will summarize our view of the current economic fundamentals, their early impact across the U.S., and as more data comes in, we can begin to understand the impact on commercial real estate (CRE) within our target markets.
Further, as we highlighted last quarter, employee densification was at all-time highs and there was early evidence of a leveling effect due to the overall economic indicators slowing. We believe this “give back of space” or reversal of densification will accelerate in the short run due to the current global pandemic that is affecting every one of us. In the last several weeks we have witnessed a massive acceleration of the mobile work force due to the governments’ restrictions on the workplace. Yes, this will affect office use going forward, but we do not buy into the ethos that office occupancies will forever change due to this pandemic, although it will absolutely adapt over the next several years. In short, this is not the end of office space as we know it, and it is too early to determine the lasting effects of the mobile work force and the real impacts to office use.
Fund Updates
Our existing Fund II & Fund III assets are continuing to perform well despite the pandemic. We have harvested several gains over the last 24 months, and we continue to be optimistic about the road ahead for our current asset base. With a few exceptions, tenants across our portfolio are by and large adhering to their lease obligations. For the months of April and May, rent collections exceeded 98%. Additionally, our asset and property management teams have instituted a number of communication and process protocols to assist with rent deferral requests and information exchange in response to COVID-19 and associated business closures. Tenants have responded positively to our proactive approach. Recent events are unprecedented for all but a few of us and have created an extreme amount of volatility, but in times like these we are reminded of the value of having some allocation to relatively illiquid investments
not subject to daily market swings.
Fund II: A full floor lease has been signed at Carolina Place, which upon commencement later this year will complete the stabilization of this asset.
Fund III: Fund III investments are well positioned and benefitting from our conservative capitalization approach. Our lower leverage strategy will continue to pay dividends for Fund III investors in the near term. Over the course of the next quarter we will resolve the remainder of the requests from tenants for rent deferrals and develop a complete understanding of the ultimate impact of COVID-19 on our rent rolls.
Cash distributions from a few of the Fund’s investments have been reduced and in two cases suspended as a result of lower rent collections from businesses impacted by COVID-19. While the situation remains fluid, our current expectation is for approximately 90% of the deferred rent at the Funds’ properties to be recovered by Q1-2021. Of the total rent outstanding at Fund III properties, the majority is concentrated in our two mixed-use projects where the impact of COVID-19 is particularly difficult for our retail and restaurant tenants.
Further, we have officially ended our investment period for Fund III as of March 31, 2020. The following summarizes the Fund III portfolio of investments as well as total capital called over the last three years:
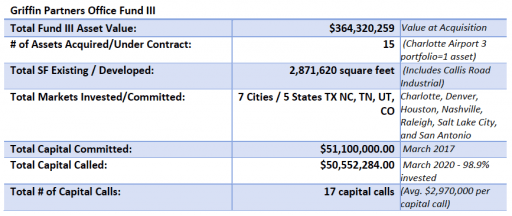
Our final Fund III capital call in March 2020 was for a new ground up industrial project in Nashville. The Callis Road Industrial Project, totals 375,000 square feet just east of Nashville off Interstate 40. Per the Investment Committee’s approval, we are continuing with the potential land site purchase totaling 32.8 acres, refining our development cost budget, as well as beginning the process of raising joint venture equity to fund the Project prior to acquiring the land.
Real Estate Market Conditions
We have watched a strong economic expansion for more than a decade, and then over the last two months an unprecedented economic, social and public health disruption from COVID-19. Since the pandemic crisis struck the U.S., all levels of the workforce and the US government continue to navigate a constantly changing environment. Due to the associated uncertainties, we continue to witness market volatility, choppy capital flows, business interruptions and a massive shift to remote work. We will see some structural changes occur in how we use office space in the near term, although this initial shock to the system has led most of our tenants to not make short or much less long-term growth decisions for their office space. In some of our assets we have been pleasantly surprised when existing tenants have opted to extend their leases with limited or no improvement allowances in exchange for pulling forward to current months, a free or reduced rent period that would have otherwise been part of renewal terms later this year or in 2021. We are happy to agree to such terms considering they push out the property’s average lease term at a capital cost less than our forecast. At a macro level, we are seeing early data points from Q1-2020 statistics that may give us some indications of what is happening to office space density, but again we don’t have enough data to support a firm opinion just yet on the long-term strategic shifts for office space use.
Generally, of our two primary property types, industrial is outperforming office post-COVID, and office will likely be experiencing the most disruption of the two going forward. As such, our commentary in this quarter’s report will be primarily focused on the emerging patterns we see in office. The first quarter 2020 office leasing activity data shown in the table nearby illustrates how a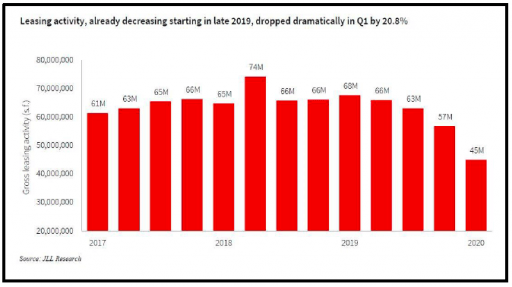 lot has changed, and we are in a much different place than year-end 2019. Overall, according to JLL, Q1-2020 “…leasing activity was down more than 20% over the quarter, with even more acute declines in primary geographies. Compounded by accelerating move-outs into new construction earlier in the quarter, absorption was effectively flat at just 5.8 million square feet across the U.S. or just less than 0.2% of inventory”. As the table summarizes we began to see leasing velocity tapper off in mid-2019, and leasing activity was basically put in reverse in Q1-2020 due to the pandemic as the gross square feet (SF) leased dropped from approximately 60mm SF to less than 45mm SF in three months’ time.
U.S. office using employment generally remained insulated from significant job losses in Q1-2020, although 53,000 office jobs were lost in March due to COVID-19 outbreak per CBRE’s latest quarterly report. This is no surprise, as we saw large job losses across the U.S., but the data is just the initial evidence as the pandemic (and the resulting lockdowns) had not spread across the country until early in March. Undoubtedly, office using job losses will continue through second quarter and perhaps beyond. We will have a better understanding of the real impacts within our target markets as well as the rest of the U.S. by this time next quarter. Per Globe Street’s Paul Fiorilla, every major metro will be impacted in some fashion and when “all is said and done, every industry and region will be impacted by the dramatic decline in economic activity, though the impact will vary by metro.” That said, our team is focused on our existing portfolio of assets, and we have shifted our priority towards maintaining occupancy versus pushing for higher rental rates. Further, to help assess and manage risk, we have analyzed our largest industry exposures, which include Professional Services (13%), Energy (9%), Finance & Insurance (5%), and Technology (4%). The upshot is we are not heavily weighted to any given industry sector and are well diversified across the portfolio.
Interestingly, the U.S. experienced year-over-year office using job growth through the end of Q1-2020, largely in the tech-driven Sun Belt and Southeast markets. The graphic on the next page summarizes the top 20 markets with gains in office-using job growth. The ranking includes all but two of our target markets. Raleigh and San Antonio are relatively small in comparison to the listed markets which bounces them out of the top 20. The market that has continued to impress is Austin, although we are not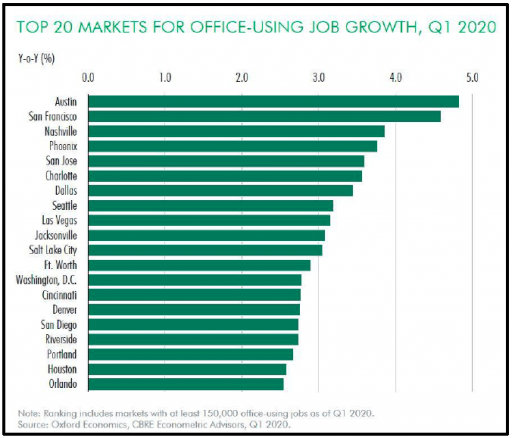 invested there (yet). We are watching Austin closely as some indicators are showing cracks in the fundamentals such as a large increase in sublease space coupled with a large amount of new supply. Construction in Austin is white hot with 5.5mm SF (9.5% of the total inventory) under construction. This is a staggering figure and the sublease and new supply metrics do not sync up (more sublease and more supply!). Typically, in a time of expansions we would see construction as a percentage of total stock in the low single digits, but Austin is an outlier and the market may have hit a tipping point headed toward oversupply. Our light switch may turn on to invest in Austin over the next 12+ months as pricing will likely cool and demand fundamentals cool. Other key markets that we target are also leaders; in particular the high growth markets of the Southeast which include Nashville (#3) and Charlotte (#6) as they have continued to display strong year over year growth.
According to the latest CBRE quarterly report (table below) overall central business district (CBD) vacancy increased 30bps in Q1-2020 for a total of 50bps increase compared to one year ago. Conversely, suburban vacancy rates rose only 10bps in Q1- 2020 for 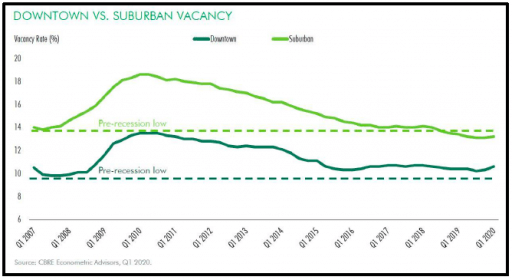 a total of less than 20bps from one year ago. It may be too early to confirm a trend of suburban outperformance with data from only quarter, but this early observation helps support our thesis of the staying power of well-located suburban assets. The next several quarters will be telling and provide us additional clues to how changes in office use will impact densely populated CBD’s across the country. Early indications hint that the suburbs may benefit as occupiers take a renewed interest in the suburbs in pursuit of less density at lower costs and reduced commutes.
On that note, a recent article in the Wall Street Journal written by Dana Mattioli and Konrad Putzier, asks “whether traditional headquarters are still necessary” which are primarily in the urban cores or CBD, and will companies “create new satellite offices to rebalance their office using employees… to have schedules that allow for these satellite offices to pop-up in less expensive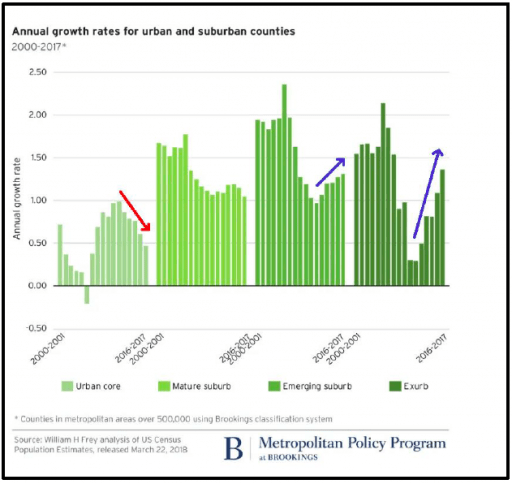 locations (e.g. suburbs!) as the workforce becomes less centralized”. In the near term the answer is yes, this will occur, and company’s arguments to do so are justified. However, as is often the case when CRE trends shift, the result will not be the death of CBD but instead a measured shift of demand towards suburban office buildings, improving their status as a viable asset class.
This trend was already underway as the leading edge of the millennial generation is experiencing accelerating household formation and slowly migrating to the suburbs. As with many trends, COVID-19 is simply an accelerant. Evidence of the millennial migration can be found in the strength of the data for new home sales, both pre and post-COVID. It can also be seen in the nearby chart showing population growth rates in urban, suburban and exurban counties across the U.S. through 2017, which is admittedly dated, but proves the trend has been underway for a while.
While positive for the suburbs, these trends do not likely signal the end of the urban core. The same WSJ article points out there have “been previous periods of time where the end of the center-city office building was wrongly predicted, beginning in the latter half of the 20th century as some companies decamped to suburban office parks and following the shock of 9/11. Each time the centralized office buildings proved to be surprisingly resilient.” We agree with this notion but think the benefit to the suburbs will be meaningful and accrue to those assets having the best locations, amenities and functionality to absorb these new tenants looking for satellite offices closer to their employees.
Two other factors companies will consider post-COVID when making decisions about their future office needs will be 1) a larger proportion of mobile workers who need less, or in some cases no office space, and 2) less density for those employees using office space. The reversal of a multi-decade trend towards more density is fairly new and certainly largely a result of COVID-19. However, in last quarter’s report, we did touch on the decline in productivity arising from the recently popular shared and open workspaces. Employers were already taking note that the hoped-for benefits of increased collaboration from these open office designs were being more than offset by declining productivity. Now, in the pursuit of a healthier work environment, employers will be able to justify lower density office configurations. But they will want to do so without increased costs or even with outright savings on their real estate if possible. The suburbs again have a compelling case to make on that metric. U.S. suburban rents are on average 10% less and some cases as much as 50% less than rents in the inner city. Our ten target markets are listed in the table below showing the rent per square foot difference and the percent rent difference between CBD and Suburban office rents. Austin, with a $17.57 or 33% delta is the clear outlier. 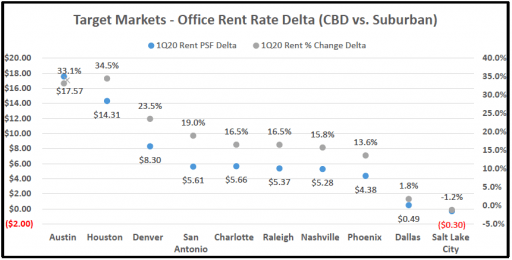 The surge in new supply of office in Austin mentioned in our earlier comments is skewing the rent delta as the high asking rents for the new CBD buildings compared to a generally older suburban stock are creating a very large per square foot and percentage delta. At the other end of the spectrum, places like Dallas and Salt Lake City have various micro markets with an abundance of new suburban “urban” supply and these two cities’ downtowns have generally underperformed the broader office market. The one other outlier is Houston, where high rates for the new CBD supply are contrast against suburban inventory which includes a large amount of semi-obsolete B minus to C space with low rents. The ten-market data set illustrates the large rent spread between the two areas and should result in tenants making a post-COVID decision to relocate or open a new satellite offices in the suburbs as the overall rental rates across our ten markets in suburban areas is around 15% less.
What companies will take note of beside a potential savings on rent, which is typically a small percentage of overall expense (less than 5%), will be that their workers would like to return to the workplace. There will be exceptions to this, but a recent survey by the global architecture firm Gensler indicates “only 12% of the U.S. workers want to work from home full-time. Most want to return to the workplace, but with critical changes.” The key piece is 1.) they want to come back to an office and 2.) employees want more space (less density) to accommodate social distancing and increase privacy. It is too early to tell the net impact on office demand of these countervailing forces which include lower employee density levels, remote working options for the workforce, the future of flexible and shared office space, and finally where employment levels stabilize when the economy rebounds. Rest assured, we will track them closely as the market evolves.
Lastly, the graphic below is from the aforementioned recently completed survey by Gensler and provides a good visual interpretation of where we are within this current cycle of understanding the real-time impacts to the workplace. As owners, developers, as well as a tenant, coupled with the entire food chain that supports office occupancies, we are reacting and proactively adapting to new changes as quickly as possible. For example, we are in the process of implementing #3, a “Reimagined Future” to use Gensler words, and we’ve taken the appropriate steps within our assets at this point, flying through #1 “Immediate Actions” and #2 “Ongoing Pandemic” in the last 60+ days.

Wuhan Woes (Continued)
In last quarter’s Market Thoughts we opened the economic discussion with the thematic heading of “Wuhan Woes” and expressed our concern about the prospects of contagion coming out of China and the impact it might have on U.S. and global economic growth. However, we cannot take credit for being prescient. We had the contagion idea correct, but the wrong path of transmission. As we now know, the mechanics of transmission turned out to be biological, not financial, and the order of magnitude has unfortunately been considerably greater than we thought possible. There will be years of debate about whether the economic damage wrought was necessary, or a self-inflicted overreaction to a bad but not existential viral outbreak. No opinions herein regarding that question. What is not debatable is the enormous magnitude of the global economic damage as almost all national governments chose a policy response to the pandemic that imposed significant restrictions on commerce in order to reduce the rate at which the virus spread.
This quarter, we plan to forgo our somewhat typical litany of economic performance statistics, they are all bad, and our readers have probably seen most of them already in a searing manner. Also, because most of the data points are multiple orders of magnitude away from their respective trend lines and values from only a couple of months ago making any assessment of their true meaning purely speculative. A bit of humor, Georg Vrba’s IM BCI recession forecasting index highlighted in our previous reports gave its recession “warning” on April 2nd …… thanks for the heads up! The above promised restraint notwithstanding, here is one economic statistic: U.S. GDP declined at an annualized rate of 5.0% in the first quarter, very likely a mere directional signal of the ugliness that awaits in the second quarter. A quarter is 13 weeks. For 101⁄2 weeks of Q1, the U.S. economy was growing close to an annualized rate of 2%. It is nothing short of astonishing it took a mere 21⁄2 weeks to convert a 2% growth quarter to a 5.0% contraction quarter.
The Great Inflation Debate
Inflation, or no inflation? Certainly, some prominent economists believe there will be significant inflation resulting from excessive monetary and fiscal stimulus once economic activity returns to trend. Inflation believers are stuck in the narrative that massive “printing” of money by the Federal Reserve must inevitably lead to inflation, on its face a thesis that was economic gospel in the textbooks and academic circles of the late 20th century. However, the Fed is not printing money. The Fed is purchasing assets on an unprecedented scale from banks and other financial institutions, including for the first time ever bringing corporate credit risk onto its balance sheet. However, as we learned in the aftermath of the GFC, much of the money created when the Fed purchases assets from banks, either from traditional open market activities or quantitative easing (QE), simply becomes excess bank reserves sitting on the other side of the balance sheet of the Fed. For the expanding balance sheet of the Fed to be transmitted into the real economy, there must be demand for loans on the part of borrowers and willingness of lenders to lend to borrowers deemed credit worthy.
In a fractional reserve banking system, which the U.S. still has despite some efforts to destroy or circumvent it, the propensity of banks to expand the money supply (M2) by creating M2 out of the monetary base is known at the multiplier, or little “m”. 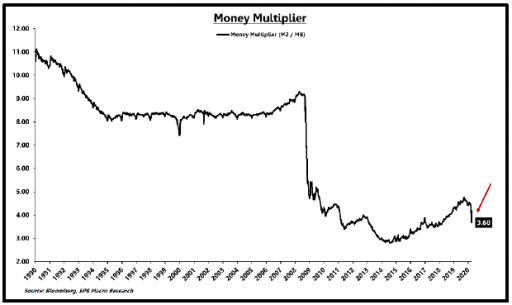 Hoisington Investment Management, a firm with whose analysis we tend to agree, has a great summary of the multiplier, as well as monetary velocity (V) (see below) and the status of monetary conditions in their Q1-2020 quarterly outlook. In brief, higher m means more money (M2) creation, lower means less. The nearby chart shows the current trend for m. Note how m collapsed during the GFC and never recovered to pre-recession levels. A sharp downturn can be observed as we enter the current recession, and it is easy to presume that a further decline will follow.
We first highlighted the impact of falling monetary velocity (V) way back in Q1-2016, then bludgeoned readers with it again in Q1-2017, both so long ago that we can no longer link to those reports on our web site. It has been long enough, and current circumstances warrant, so here it comes again. Simply stated, V “is the frequency at which one unit of currency is used to purchase domestically- produced goods and services within a” year (Federal Reserve). Total GDP equals the money supply (M2) times the number of times the M2 turns over (V). As such, all else being equal, for monetary policy to be effective a stable or slightly rising V is needed. Currently, as the nearby chart indicates, V is at multi-generational lows, dating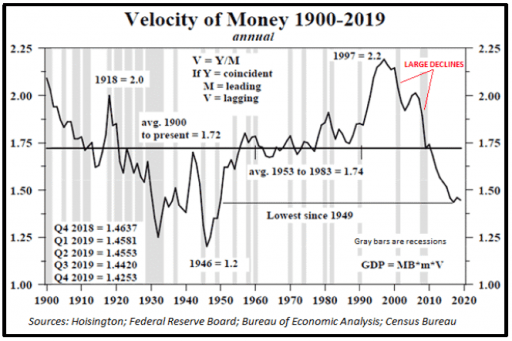 back to the period right after WWII. The chart also clearly indicates that V has declined dramatically in the last two recessions and not recovered after recessionary conditions subside. It is rational to conclude that V will decline further during the current recession. Several economists have demonstrated that velocity declines as the overall debt level in an economy increases, and per Hoisington’s analysis, is significantly impacted by the marginal productivity of new debt, or the magnitude of the excess revenue a new loan generates over its principal and interest repayment requirements. Graphs showing the rapid growth of M2 are appearing now in economic analysis and discussion, often with expressions of alarm and proclamations about the certainty of inflation to follow.
 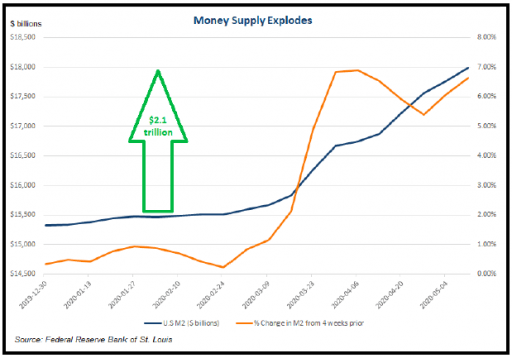 Here is just such a chart. The data indicates that banks must be making loans to convert the monetary base into M2. In fact, we know they are from watching the evening news. To date, about $0.5 trillion of the $2.1 trillion increase in M2 since March 16th is a direct result of just the SBA’s CARES Act PPP loans that the banks have made. Some large portion of the remaining $1.6T is also likely the Fed’s purchase of debt instruments from non- bank institutions which results in a rise in M2 when the seller deposits the proceeds in their bank. However, neither of these influences is likely to last. The federal government will be bringing the PPP loans onto its balance sheet as it purchases ultimately all the PPP loans from the banks. The government will issue new debt to generate the funds with which to pay the banks to purchase the PPP loans, and most of that new government debt will be purchased by the Fed and thereby end up as excess reserves on the Fed’s balance sheet, not M2. The deposited proceeds from non-bank sellers of debt instruments to the Fed will eventually migrate into excess reserves also, unless the banks find private borrowers to whom they are willing to lend those funds.
There is very little evidence to support an argument that the velocity of money (V) will rise significantly; there is, however,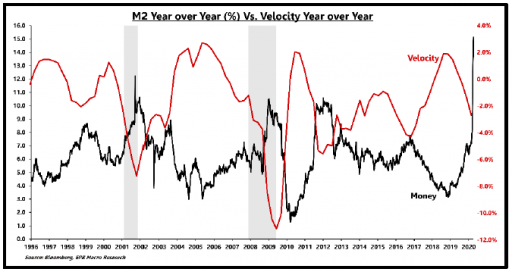 evidence indicating the U.S. could be in for a substantial collapse in V. The chart nearby shows a clear inverse correlation between the rate of change in M2 and the rate of change in V, measured year-over-year. We know GDP is contracting, 5% in Q1 and likely a higher rate of contracting in Q2. By definition (GDP=M2 x V), if M2 is rising and GDP is falling, then V must be declining.
To summarize the ramblings above on monetary policy, while the stabilizing benefits of the Fed actions to provide liquidity to markets are important, the ability of the Fed’s policies to truly stimulate economic growth is considerably muted by low and declining m and V, and the policies are becoming less effective over time as the economy becomes more indebted with each unit of debt having a lower marginal return.
Stepping beyond monetary policy, in order for inflation to accelerate there must also be growth in aggregate demand. And just on cue, all the dyed in the wool Keynesian economists are beginning to chime in that the massive fiscal stimulus embodied in the CARES Act will spur aggregate demand. Which of course, when coupled with the Fed’s money printing, they argue, will cause a dramatic acceleration in inflation… eventually. Two points to consider on the above. First, so far, much of the CARES Act payments to individuals are being saved, not spent. Partly because it is hard to spend in a lockdown, but also because in 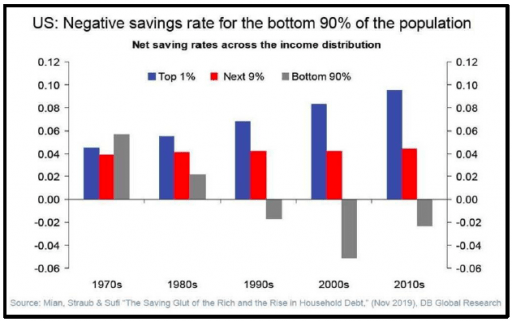 recessionary environments with a large amount of economic uncertainty, consumers tend to postpone spending and save more. Savings is a good thing for economies; however, one problem with savings in the U.S. is that it is largely limited to the top 10% of earners (see chart), thus muting the potential for a quick rebound in spending when the lockdowns end. Second, much of the CARES Act is not stimulus but instead simply increasing the leverage on the government’s sheet to replace lost revenue and wages. In those circumstances, the funds received do not generate incremental spending, i.e. no increase in aggregate demand. For example, the SBA sponsored, bank originated PPP loans should not be considered stimulus in the conventional sense. Proceeds of these loans are for the most part replacing businesses lost revenue. With respect to service businesses, those lost revenues can never be recaptured because a large component of a service transaction is time. A manufacturer might be able to recapture a portion of the lost revenue if it continued production and built up inventory during the lockdown, or by running extra shifts after reopening. For the most part however, lost service industry sales are permanently gone.
Another deflation force is described well by EPB Macro Research and illustrated in the chart on the next page. EPB: “Recessions exacerbate excess capacity. The current recession is one of the worst economic crises the country has ever faced. The rate of inflation nearly always declines during recessions and typically does not trough for years after the conclusion of the recession and the eventual reduction in excess capacity. A severe recession usually knocks several hundred basis points off the rate of core inflation. Currently, the economy is structured to accommodate over 150 million jobs. In a matter of weeks, the economy will have a gap of 20 million jobs relative to the peak. This gap is a highly deflationary force.” The chart on the next page shows a correlation between the core consumer price index (CPI) and the rate of change in non-farm payrolls. Of course, correlation is not causation, but the odds appear to be stacked against inflationary pressures at least until there is meaningful improvement in the job growth picture.
Is the data reflecting these theories? – So far at least, the answer is a definitive yes. Evidence of deflation was prevalent in the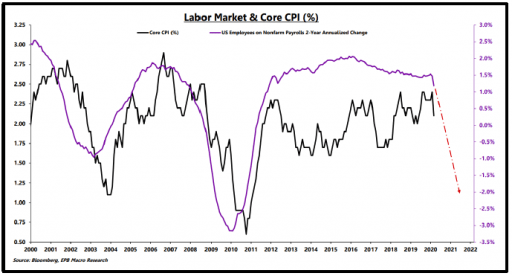 April economic reporting period. The headline CPI, the producer price index (PPI), and import price index fell -0.8%, – 1.3%, and -2.6%, respectively, on a month over month basis. Each of the “core” measures of these indices, which exclude food and energy price changes, also declined in April, falling -0.4% for core CPI, -0.3% for core PPI, and -0.5% for price changes in core imports. The headline CPI rose just 0.3% year-over-year in April, which was the third-worst reading for year-over-year headline inflation in over 30 years.
Because we cannot help it, we must mention oil prices. On more than one occasion in the past, most recently in Q2-2018, we have opinioned about the long historical relationship between bouts of serious inflation and the corresponding high price of oil during those periods. Ignoring the recent negative spot price that arose from insufficient storage capacity, the price of oil has fallen over 70% from the cyclical peak. According to Hoisington, this is unprecedented for a major recession. Extrapolating the impact of oil price changes from prior recessions, Hoisington projects that “core PCE [inflation] could recede to a 1% rate of deflation, with the overall PCE [headline inflation] measure deflating at 4% or more.” This would be unprecedented since the time of the Great Depression.
As stated above, the Fed cannot “print” money in the sense that most people assume when they use that phrase. The Fed does not directly pay the bills of the US Treasury. To do so would be against the law. The Treasury must first issue debt securities to the market, which the Fed can then buy. However, congress could change the Federal Reserve Act to allow for direct money printing. This actually happened in the U.K. recently on a small scale. If congress does change the law in such a manner, then all bets are off, and the dynamics described above become much less relevant. In that circumstance, high inflation would be very likely.
Don’t Worry, The Debt Markets are Open!
Borrowing money is easy now, both for the government and for corporations, even corporations with marginal credit ratings. The volume of recent debt securities offerings has been historic. Investment grade companies issued $259 billion of debt in March, and $285 billion in April, both significantly more than the previous record of $178 billion recorded in May 2016. An issue we warned of last quarter was the prospect of borderline investment grade companies being downgraded and setting off a wave of selling. There were a record number of borrowers in this category of barely above junk rating in the first quarter, according to Moody’s. As a result of the economic free fall in the past 60 days, it seems clear that a sizable portion of these issuers could lose their investment grade rating.
Today’s borrowers are accessing the capital they need to get through the crisis. But does leveraging up even more have consequences? We have bemoaned the issue of excessive debt and the diminishing marginal productivity of that debt several times in past writings, as recently as last quarter. Excessive debt burdens do have consequences, but in the aggregate, they are hard to see or detect. Like the frog in a pot of water brought to boil, the incremental change goes by unnoticed. Debt pulls future consumption forward and only produces growth when the proceeds are invested in production capacity (either mfg. or service capacity) that generates an economic return in excess of the cost to service the debt. Each incremental dollar of debt is yielding lower returns. A transfer payment (taxing John to pay Martha’s pension) does not produce an economic return. Furthermore, some of the corporate borrowing is being invested in restructuring business processes, and while that may ultimately lead to more efficiency, in the short run efficiency and productivity will decline for many businesses. One of the themes of restructuring is resilience versus efficiency, which might imply be definition a bit less efficiency. It is unclear the impact the restructuring will have on employment in the long run. Presumably, if there were large pockets of highly inefficient employment, management teams would have already made changes pre-COVID to eliminate them.
The federal borrowing binge is another order of magnitude. This year alone the deficit is likely to exceed $3.5 trillion, or approximately 18% of GDP, another data point that comps all the way back to WWII. The deficit for fiscal 2021, which begins in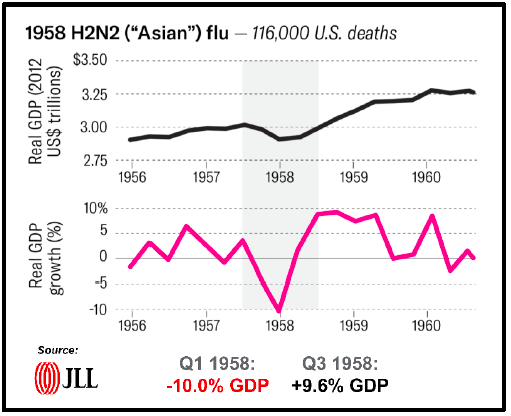 October, is likely to be another $2.5 trillion according to some estimates. These are obviously unsustainable and will further constrain economic growth. Worse, the level of intrusion by the government into commerce will be as high as ever, and the impact of that government influence will undoubtedly distort the U.S. form of market capitalism in damaging ways.
What Shape the Recovery?
Equity markets seem to indicate we should expect a V shaped recovery.
Most economists are predicting a U shaped recovery, and some of the
pessimists are putting forth the gloomy L shaped recovery as the most likely outcome. Then there is the W and Nike Swoosh….. Take your pick! Reports on the pace of recovery coming out of China appear to give credence to either a U shaped rebound or the Swoosh. Co-CEO of The Carlyle Group, Glenn Youngkin said in a recent webinar that capacity in Asia has returned, but there is very little new capital investment.
While there is reasonably good production data out of China, Chinese consumer confidence remains low, which is suppressing big ticket purchases. Carlyle sees a U-shaped recovery for the U.S. filled with “fits and starts, and we should expect continue volatility in the public markets.” The last time the US economy was noticeably impacted by a pandemic was the Asian Flu of 1957-1958. The chart on the previous page shows that the U.S. had a V shaped recovery from the 1957-1958 pandemic. For our readers who like to trace patterns, it is very interesting to observe that the number of deaths from the Asian Flu were 116,000, a figure possibly close to where COVID-19 will end up, assuming accurate accounting and barring a big viral rebound in the fall. Also, the contraction in the first quarter impacted by the virus in 1957 was -4.2%, similar to Q1-2020. Extending the comparison further, the chart would tell us to expect a -10% contraction in Q2-2020. The quarters that followed that -10% contraction in 1958 were +2.7%, +9.6% and +9.7%. It was five quarters from the first down quarter in 1957 before total GDP exceeded the prior peak level. That would translate to Q3-2021. Looks like a U to us. Stay tuned.
Looking Ahead
We believe that the shape of the commercial real estate recovery will be an elongated U because of the disruptive factors outlined in report above. A deflationary environment is not good for corporate profits or indebted businesses and should therefore result in an expansion of the spread between government and corporate yields. CRE cap rates are much more correlated to corporate debt yields than to treasuries, so even though the treasury yield curve will be anchored close to the zero bound, cap rates are not likely to follow the treasury yield curve down.
The largest amount of uncertainty facing the global economic outlook could very well be the generational tensions underlying the geopolitical struggle between the U.S. and China, as opposed to the epidemiological path of the coronavirus. We are seeing the tip of that iceberg in the tension in Hong Kong now as China moves to impose its extradition law in violation of the Sino-British Joint Declaration which was supposed to run through 2047. Is China playing a bet that the U.S. will sell out Hong Kong in exchange for China adhering to the trade deal? If China imposes its undemocratic political prerogatives on Hong Kong, the Hong Kong banking system is likely to collapse, and the risk will rise of a mass exodus of those who can leave. The U.S. decoupling with China will certainly accelerate. At the moment, China appears willing to accept lower growth and is avoiding massive debt fueled stimulus, perhaps in preparation for significant geopolitical fallout.
Thought experiment: which of the world’s two largest economies is more “managed?” Authoritarian control and financial engineering are replete in China, but is that also now true in the U.S.? During COVID- 19 in the U.S., the government can tell you not to work, pick business winners (essential) and losers (non- essential) and the Fed and treasury are wallowing in an explosion of financial engineering. The Fed and the treasury have “socialized the risks of capitalism.” So, one of the important long-term macro trends to watch will be whether the U.S. will follow a more traditional free market path out of the crisis, or whether the country drifts further towards relying on the managed economy. What are the indicators to watch? Some are political with the November elections looming large. Will leaders who have leaned toward more government control over economic and personal lives be rewarded, or will the political benefits swing to the other side? Another indicator will be pricing of assets and risk. Will repricing be allowed to run its course, including the clearance of surplus assets through bankruptcy, or will the Fed and treasury step in
to mute the pricing signals. Indications to date are not great on this score. We made a note above about the likely expansion of corporate debt spreads over the treasury curve resulting from a deflationary environment. Such an occurrence would be an indicator of the market being allowed to properly price risk. Will the Fed let that happen? So far, the Fed’s response has not been encouraging as one of its early responses is to step into the corporate debt market to “support” prices, an action taken under the pretense of sustaining “market stability.” Once market volatility subsides, will the Fed let corporate spreads expand? Keep an eye on it.