We mentioned in our Q3-2019 market report that many existing and prospective partners ask about the trend towards higher office densities and what the long-term impact is on overall office demand. We gather and evaluate data on the subject because it is important to our investment strategy for the portion of our capital allocated to office investments. Occupiers are certainly seeking higher density and more collaborative space, and investors must consider how to adapt investment strategies. One of these recent trends is co-working, which is a piece of the puzzle, but more importantly we’ve taken a look at demographic shifts coupled with how the typical corporate office users (as well as small occupants) could fundamentally disrupt office occupancy and the long-term value of office assets. For the moment, suffice it to say the reports of the death of office as an asset class are premature. Below we summarize these office density trends and how we are adapting our overall investment strategy.
Fund III activity was moving at a rapid pace in the last six months of 2019, and we are now diversified across six (potentially seven!) of our ten target markets: Charlotte, Denver, Houston, Raleigh, Salt Lake City, San Antonio, and potentially Nashville. Since June 2019 we’ve purchased five assets and secured two under letter-of-intent (LOI) control, totaling over 1,015,000 square feet office and industrial space with a total acquisition value of over $150,000,000.
As of year-end 2019, we had reviewed 449 investment opportunities, a 30% increase from last year, and we will have advanced to the final bid round for marketed deals or LOI negotiation for off market deals significantly more often than last year.
Fund Updates
Fund II: No substantive updates to report, and we refer you to the Managers Letter for any specifics on remaining assets in Fund II.
Fund III: Q4-2019 was another active quarter for the TEAM. In December 2019 Fund III closed on the purchase of the Saturn One office building in Nassau Bay (SE Houston), Texas, a 102,000 square foot asset that is 100% leased. Saturn One was originally developed by Griffin Partners in 2011, as part of the Nassau Bay Town Square mixed-use development. The Class A+ asset has a weighted average lease term (WALT) of 4.1 years, a high proportion of credit tenancy, and track record of 100% tenant retention (all existing tenants have remained since completion). The property has a diverse and secure rent roll projected to provide an attractive cash yield.
Subsequent to the close of the quarter, Fund III closed on two additional office buildings in the Houston MSA. The first, Concourse at Westway, is a two-story office building totaling 131,000 SF. Currently 56% leased, the project is in an excellent location inside a well-established business park in northwest Houston. This high-quality property has been institutionally owned and maintained and has significant value-add potential through the lease up of the remaining 44% vacancy.
Secondly, Fund III closed on 2900 Weslayan, an urban in-fill mixed-use office project totaling 137,000 square feet, which is currently 81% leased. The investment represents a strong value-add opportunity to fill existing vacancies and stabilize the rent roll. In-place leases have a WALT of 4.5 years anchoring strong projected total returns and a healthy cash yield. This purchase includes a 0.73-acre adjacent land parcel on the hard corner of an excellent intersection. The 0.73 acre track currently houses a decommissioned multi-lane drive through banking facility. This surplus land is ideal for future vertical ground up development, as well as an immediate low-cost redevelopment into an amenity for the existing office building.
These two investments were our last Fund III office investments in Houston. As mentioned in our last report, the Fund III Investment Committee and the Griffin Partners Investment Management Advisory Committee monitor capital allocations to ensure appropriate geographic diversification and avoid overexposure to any particular market, including Houston. With these latest investments, the Fund’s equity allocation to Houston office is approximately 29%, a comfortable allocation within a diversified portfolio of thirteen (13) assets across six (6) of the ten (10) target markets we cover.
As of December 2019, we have sold our first Fund III investment, Arapahoe Business Park and 345 Inverness in Denver, CO, a ten-building industrial flex portfolio that included two assets, purchased in May 2016. The asset produced a solid return considering our objectives were driven towards a stable cash yield as an initial investment for Fund III with a “value-add light” strategy.
Real Estate Market Conditions
As noted at the outset, investors have inquired about evolving office use trends and the implications on space demand. In prior quarterly reports, we have referred to how office density continues to rise and therefore less space is needed to house more employees. So, one should ask how does this continued densification impact the demand for office space, and how does this impact the overall value of office assets?
Our TEAM has completed a deep dive into why office densities have changed, and Kevin Ellis, an Acquisition Associate, has led the charge on providing the materials used in our understanding this topic and the discussion that follows.
First, Corporate America is doing everything in its power to save money on occupancy cost. A few key take-aways: the average cost of real estate per person is $6,680, of which 66% is rent and 34% is operating expenses, and across the U.S., most companies occupy less than 80% of their space. As the graphic on the next page depicts, the average square foot (SF) per employee fell from about 220 SF in 2010 to 195 SF in 2019. The graphic also shows what happens during times of overall expansion and downsizing in the US economy. For example, the 1990’s was an historic long-term expansion of the US economy and during that 10+ year time frame the number of employees per square feet started at 225 SF/employee around 1991 and by the early 2000’s just prior to the tech-wreck (US downturn), density dropped below 185 SF/employee. The same is now occurring since the Global Financial Crisis (GFC) in 2009 to today. Currently, we are inching closer to the previous record levels of overall employee density. There is a correlation between office density and economic expansions. Because office leases are generally set for 5 to 10-year periods, continued hiring during economic expansions leads office density to naturally increase. Conversely, continued layoffs during downturns means less workers are in the same office space so density decreases.
Another factor is the changing work force. As we all know Baby Boomers are not getting any younger, and the almost the entire generation will be over 65 in than 10 years. The largest cohort of the work force over the next ten years is Generation Y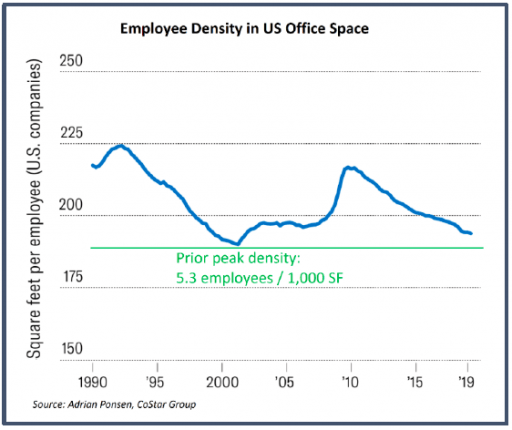 (Millennials). Gen Y will make up 40% of the work force over the next decade, and in 2030 the first millennials will be 50 years old! This work force is highly collaborative, and 71% say they’d prefer a work-life balance over a well-paid job. 88% of Gen Y wants to be able to choose where and when they work, but most still want to work in an office regularly and one-third of this generation state their environment is their top priority.
Further, Generation Z, currently the largest cohort in the world, with over 2 billion people (~26% of the population), was raised in the ever-present war or terror and post GFC economy. The table below from Pew Research Center depicts the US population by Age as of 2020.
Gen Z is likely to focus more on security and stability than Gen Y, with less interest in entrepreneurship. They are the first 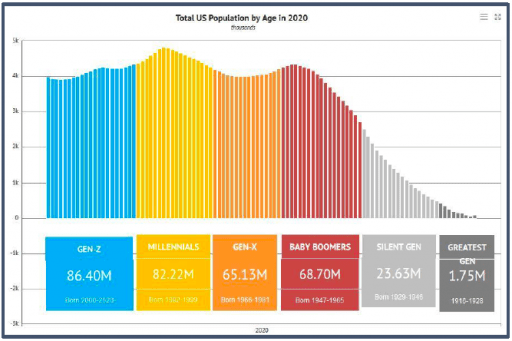 generation to grow up entirely in a digital world. Many lack experience building social skills and struggle with social anxiety. I think none of us would be surprised to learn that almost 40% of Gen Z say they are concerned technology has damaged their interpersonal skills. Duh, we see this all the time, kids today (ages 10 to 17+) sitting in a public group setting, and ALL of them are staring at their phones….with no real social interaction!
So, on that note, Gen Z is likely to be less socially oriented than Gen Y with a tendency to control their own workspace and create a wall around themselves regardless of how “open” the office plan may be. They are simply less interactive. The key take away is Gen Z is less “socially collaborative” and more likely to be “technologically collaborative”. For example, according to a Harvard Business Review article published in Nov-Dec 2019 issue, “Gen Z” creates “…..a Fourth Wall, and their colleagues come to respect this. If someone is working intently, people don’t interrupt. If someone starts a conversation and a colleague shoots him a look of annoyance, he won’t do it again. Especially in open spaces, fourth-wall norms spread quickly.”
So, what does all this mean for a changing work environment? The table nearby shows that the new generation of workers prefer using flexible office space or to work from home or “anywhere” vs. working a permanent office. On the flip side, the emerging consensus, supported by recent research, is that open plans (flexible office space) are detrimental to productivity, primarily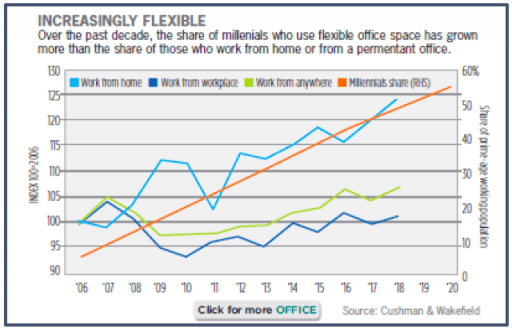 by failing to create more “social collaboration” but instead driving more “technology collaboration.” As recent studies indicate, 70% less face to face interaction occurs and there is a 50% increase in email communication. Wow! Very interesting and counter to the prevailing narrative. The sensory overload of open offices seems to trigger a withdrawal response where workers crave less interaction, creating this “Fourth Wall”. Further, the constant audience creates the pressure to always look busy and in turn lowers work productivity. A specific example is employees in open office concepts take 62% more sick days than employees with their own office. Corporate America and business owners watching their bottom line will not tolerate this forever, and the space planning pendulum will swing back towards more available areas of privacy. Open concept plans have proven to decrease attention spans, creative thinking, and job satisfaction. The upshot is it may “look cool”, but it doesn’t work…..for employees or employers!
Taking this one step further, how has this densification effected overall office real estate trends? According to Newmark Knight Frank in a research piece called “The Future of Commercial Real Estate”, in the 12 largest metros average transactions under 10,000 square feet have decreased annually since 2016, with average leasing volumes moving from approximately 1,500 leases in 2016 completed to just under 900 leases completed in 2019. This single statistic can take on several different meanings; the economy may be slowing down for overall small business owners, densification is a continuing trend, and most importantly office owners need to adapt their investments to create workplaces that tenants are seeking. The “Tighter Quarters” table (next page) from Transwestern shows respondence surveyed believe densification will increase in 2020.
This continued slowdown in the volume of signed leases has spurred office owners to spend up front capital in order to lure new and existing tenants to their spaces. One of the most apparent manifestations of this spending is the “amenity race” we are seeing 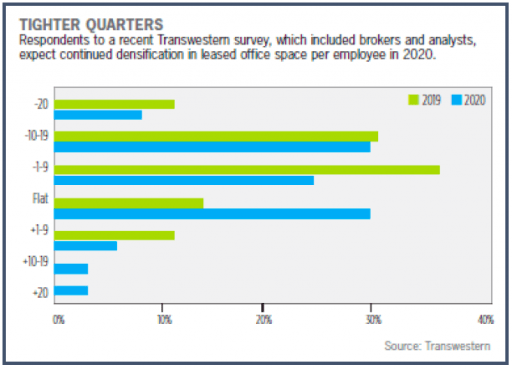 across the office sector. This new amenity standard was also ignited by the high- end workplaces offered by coworking firms. These coworking firms opened the door for conventional companies to access amazing workspaces which were previously for the who’s who list in either SoCal, lower Manhattan, or the hip North Loop area of Chicago; not anymore! This amenity race has significantly increased tenants’ expectations of the workspace, setting new “bars” (pun intended) for Landlords. Couple this expectation with rising labor costs, and it is no surprise we have seen significantly higher Tenant Improvement Allowances (TI’s). Per Newmark Knight Frank “The Future of Commercial Real Estate”, across nine major cities average TI’s increased from about $35psf in 2009 to almost $68psf in 2019, that is a drastic increase!
It’s clear that the pendulum has swung too far toward more densification and in turn “open-space” plans. As studies have proven, densification backfires, and owners and tenants (large and small) will move to something in-between fully open office concepts and the traditional office layouts (offices with walls). As corporate America is fighting for talent through the “amenity” and “densification” race, they will now need to employ a balancing act that gives employees personal space to concentrate and work productively, while maintaining the “cool factor”.
As we’ve seen in times of economic downturn, employee densification reverses (circa 1991 or 2000) as the number of employees is less as a result of layoffs while longer dated lease obligations take some time to adjust. What’s clearly evident now is the leverage is with the employees because of the on-going economic expansion, but this will shift back to employers in the next economic downturn. So the best conclusion from the data and our experiences as a Landlord is, we should continue to provide amenities (we’ve jumped into the “amenities race”) and do our best to stay in the middle of the densification pendulum in order to retain long term occupancy for our investments.
The Wuhan Woes
COVID-19 (coronavirus) has dominated the news of late, and fears of it have devastated equity oriented financial assets worldwide for several days as we are going to press. Various statistics such as energy consumption and travel paint a picture of a Chinese economy that is clearly buckling under the strain. How quickly China’s economy can return to normal, and how much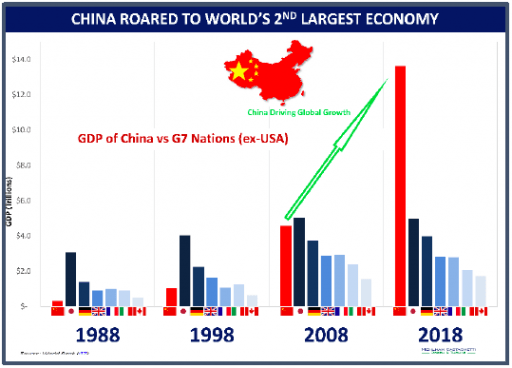 impact the disruption will have on Q1 and annual growth for 2020 are uncertain. China’s economy was slowing prior to the pandemic.
Does it matter? In 2003 when the SARS epidemic emanated from China, the proportion of world economic output attributable to the Chinese economy was considerably smaller than it is now. Since then, China’s economy has rocketed to the second largest, far ahead of number three Japan. See accompanying chart. Could there be financial or economic contagion if China suffers a severe downturn? According to Wells Fargo, foreigners own about $400 billion worth of dollar denominated Chinese bonds. Foreign banks hold loans to Chinese households, businesses and governments which when combined with the dollar bond exposure shows that China’s external debt currently totals roughly $2 trillion, up from $1.3 trillion three years ago. The external debt of Chinese banks accounts for nearly one-half of the total.
While $2 trillion seems significant, China’s external debt is considerably smaller than the United Kingdom ($8 trillion), Germany 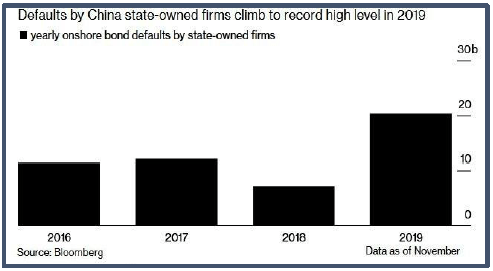 and France (~ $6 trillion each), and the U S (nearly $20 trillion) and is a relatively low and manageable 14% of GDP, well below the 50% threshold generally considered to be worrisome. Further, thanks in large part to capital controls, the $2 trillion is diversely held with no important foreign economies having excessive exposure. Despite what appears to be a manageable amount of external debt, many economists are asking what might happen to the global financial system if China defaulted on a major portion of this external debt. Notably, there has been a rise in defaults on internal debt shown in the nearby chart.
Most of the sober economists we have read on the subject believe a major crisis in China, while consequential internally to China, would not likely have extensive direct financial effects on other countries, but more likely would have meaningful indirect effects on other global economies. Wells Fargo: “…… a financial meltdown in China would probably cause a painful economic downturn in {China}, which would impart a significant shock to global growth via the exports that China takes in from the rest of the world.” Hardest hit would likely be the industrial elements of the Eurozone, particularly in Germany, which is the most exposed to China with roughly 3% of GDP exported to China.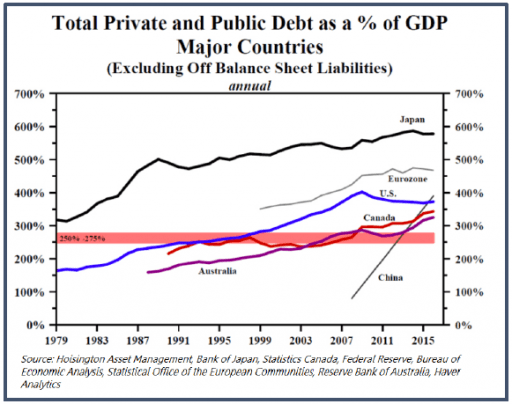
Large multi-national companies with significant supply chain disruptions as well as sales in China are certainly going to be negatively impacted. If one were looking for black swans, it would not hurt to consider whether the impact of COVID-19 might break the back of the camel that is the bloated and teetering BBB corporate credit market.
What are the odds of an internal crisis in China? Part of the answer must start with an examination of how China grew so large, so fast. While China’s long-term demographics will certainly present problems in the coming decades, the untapped productive potential of its massive population has been the biggest source of explosive growth since Deng Xiaoping and his likeminded reformists unleashed a “socialist market 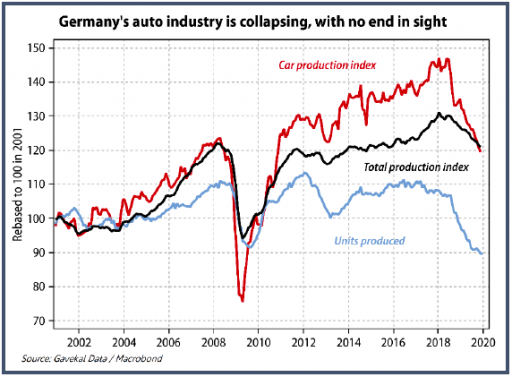 economy” in December 1978. However, looking back at the chart on the previous page and observing the parabolic growth experienced by China, it is hard to imagine that demographics alone could account for this unprecedented growth rate. Indeed, there is another factor, debt. In the nearby chart, while all of the lines are worrisome in dimensional terms, there is one line that stands out. The growth rate of total debt in China is as unprecedented as the economic growth rate.
Examining the areas of major global economic activity most at risk for contagion, the Eurozone stands out. German industrial activity has been contracting for several quarters, led by a severe slump in the auto business of a magnitude reminiscent of the global financial crisis (GFC) in 2008-2009. The nearby chart of German auto production needs no explanation. While there are likely many contributing factors to the fall of German industrial might, one must consider the central role of its dominant auto industry. According to Statista, Global auto sales peaked in 2017 at 79.6 million units and have been gradually declining since. The forecast for 2020 is 74.1 million units. Demand for cars is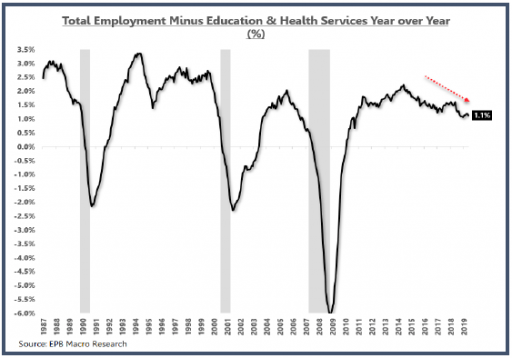 colliding with environmental reservations, changing generational preferences, energy transitions, advances in technology, urbanization and demographic changes, all of which are long term factors which will not resolve themselves for some time. Coupled with a rise in China’s internal production of vehicles, Germany’s exports of cars and industrial machinery to China may never return to its previous peak. It is likely that the implications of this secular decline in the global auto industry are not yet well understood by economic policy makers.
US growth was already slowing prior to the outbreak. Despite the positive headline jobs number in January of 225,000 new non-farm payroll jobs, the historical revisions erased almost 500,000 previously “counted” new jobs, eliminating a large part of the late 2018 surge in jobs. (Perhaps a diatribe for another day, but virtually all the major 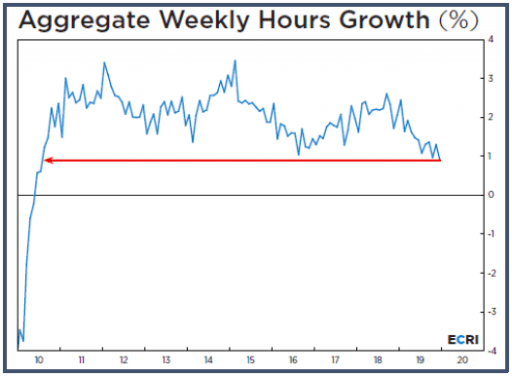 economic statistics prevalent in every economic discussion – GDP, inflation, unemployment, etc. – are imprecise estimates!) Like the Eurozone, industrial elements of the US economy have been week, offset by what has been to date, strong consumer metrics. Unsurprisingly then, cyclical parts of the US labor market have been weak, displaying falling rates of growth. Service sectors such as education and health are growing strongly, up 2.6% year over year through January, and are a large enough component of the overall labor pool that they are boosting the growth rate for total employment. Interestingly, education and health service jobs have not declined on a year over year basis for over three decades. One of the economists we follow examined what overall employment growth looks like if you remove education and health service jobs. Result, the rate at which total non-education / health care jobs is growing has been in secular decline since 2014, falling to a rate in January of just 1.1% year over year (nearby chart).
There are a few other concerning elements of the January US jobs report that belie the good headline number. Most notably in our opinion, because it underpins the strong consumer who has buoyed overall economic activity, the growth rate in total hours worked has fallen to a level not seen since the US emerged from the GFC in 2010. See chart on previous page. If this particular growth rate continues to decelerate, the robust consumer support to US growth will begin to evaporate.
What do the smart guys think about the likely COVID-19 impact on the US economy…..precisely. (In their defense, the following figures were published 10 days prior to our publication and do not reflect the recent pandemic panic…which may actually make the them more useful!) Goldman Sachs Global Investment Research has studied the impact on US and global growth rates associated with past disease epidemics, identifying weaker growth of up to 1% in the quarter of the pandemic peak, followed by a rebound the next two quarters. Goldman is estimating a 0.8% reduction in US annualized growth in Q1, and a rebound impact of approximately 0.3% in Q2, 0.4% in Q3. On balance, Goldman believes that cumulative net effect on the annual GDP would be minimal; however, “the risks are clearly skewed to the downside until the outbreak is contained.”
Subsequent to the publication of Goldman’s estimates above, the markets, especially the bond market have priced in those downside risks Goldman cautions of and may continue to press that pricing further. The yield curve has flattened considerably and some portions of it are again inverted.
Interest Rates
As a response to pandemic driven effects on global growth, and in part due to the long end of the yield curve falling precipitously, many pundits are crying out for more monetary and fiscal stimulus. As if there wasn’t enough of that already! The problem with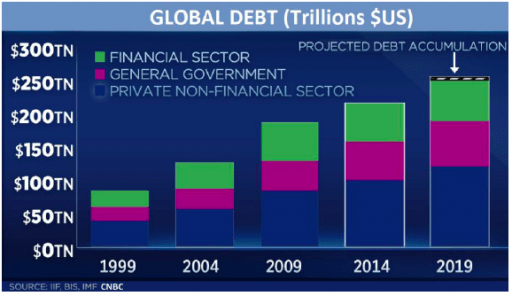 both those policy levers is they transmit their effects to the real economy primarily through higher levels of debt, and the world already has too much debt (see chart, also the % of GDP chart two pages prior). Count us firmly in the camp that believes excessive debt serves only to lower FUTURE growth rates for a handful of reasons, the most significant of which is by pulling future demand forward to the present. For a generation we have lived in a world where the future demand being pulled forward was the “next” decade’s demand…. or even the decade after that. But as the debt has ballooned, the date the piper must be paid draws more near and in all likelihood is almost upon us. For the past decade, the day of reckoning has been postponed by having the world’s major central banks absorb a significant portion of the debt by bringing it onto their balance sheets. The Federal Reserve’s balance sheet, at $4.1 trillion, is now over $300 billion larger than it was in September 2019. So even though the Fed has stopped lowering its short- term policy rate, it has been substantially easing monetary conditions by purchasing Treasury-bills. The Fed claims it will stop this debt monetization in the spring, but there are many who doubt it will be able to do so. Some economists suggest there is no reason not to monetize the debt since the huge balance sheet expansions over the past decade have yet to produce evidence of meaningful inflation. A version of this argument is called Modern Monetary Theory (MMT). Our view of MMT is that it is bunk, and the excessive amounts of debt will eventually have to be repriced. For those who hold the debt as an asset, that repricing will be very painful. Some politicians like MMT because it is a free lunch. We don’t believe in free lunches.
In addition to pulling demand forward, the productivity of debt continues to decline. The last chart this quarter is one we first brought to our readers a few years ago. Regrettably, it appears to be an inexorable long-term trend showing no signs of reversal. 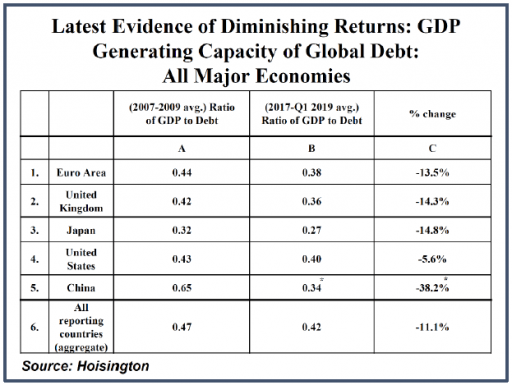 The productivity of debt in terms of how much GDP growth is achieved by incurring additional units of debt continues to decline across all major economies. And guess whose economy has suffered the greatest decline in debt productivity? Bonus points if you guessed China!
If populations in the major economies where the lion’s share of the debt resides were expanding, then the whole issue might be less concerning, but the population in aggregate across the developed world is growing slowly, and at a decelerating rate and is even declining in several
large countries (read Japan). The result, per capita debt keeps growing at an accelerating rate. Eventually there will be a “repricing.”
We mentioned in our Q3-2019 market report that many existing and prospective partners ask about the trend towards higher office densities and what the long-term impact is on overall office demand. We gather and evaluate data on the subject because it is important to our investment strategy for the portion of our capital allocated to office investments. Occupiers are certainly seeking higher density and more collaborative space, and investors must consider how to adapt investment strategies. One of these recent trends is co-working, which is a piece of the puzzle, but more importantly we’ve taken a look at demographic shifts coupled with how the typical corporate office users (as well as small occupants) could fundamentally disrupt office occupancy and the long-term value of office assets. For the moment, suffice it to say the reports of the death of office as an asset class are premature. Below we summarize these office density trends and how we are adapting our overall investment strategy.
Fund III activity was moving at a rapid pace in the last six months of 2019, and we are now diversified across six (potentially seven!) of our ten target markets: Charlotte, Denver, Houston, Raleigh, Salt Lake City, San Antonio, and potentially Nashville. Since June 2019 we’ve purchased five assets and secured two under letter-of-intent (LOI) control, totaling over 1,015,000 square feet office and industrial space with a total acquisition value of over $150,000,000.
As of year-end 2019, we had reviewed 449 investment opportunities, a 30% increase from last year, and we will have advanced to the final bid round for marketed deals or LOI negotiation for off market deals significantly more often than last year.
Fund Updates
Fund II: No substantive updates to report, and we refer you to the Managers Letter for any specifics on remaining assets in Fund II.
Fund III: Q4-2019 was another active quarter for the TEAM. In December 2019 Fund III closed on the purchase of the Saturn One office building in Nassau Bay (SE Houston), Texas, a 102,000 square foot asset that is 100% leased. Saturn One was originally developed by Griffin Partners in 2011, as part of the Nassau Bay Town Square mixed-use development. The Class A+ asset has a weighted average lease term (WALT) of 4.1 years, a high proportion of credit tenancy, and track record of 100% tenant retention (all existing tenants have remained since completion). The property has a diverse and secure rent roll projected to provide an attractive cash yield.
Subsequent to the close of the quarter, Fund III closed on two additional office buildings in the Houston MSA. The first, Concourse at Westway, is a two-story office building totaling 131,000 SF. Currently 56% leased, the project is in an excellent location inside a well-established business park in northwest Houston. This high-quality property has been institutionally owned and maintained and has significant value-add potential through the lease up of the remaining 44% vacancy.
Secondly, Fund III closed on 2900 Weslayan, an urban in-fill mixed-use office project totaling 137,000 square feet, which is currently 81% leased. The investment represents a strong value-add opportunity to fill existing vacancies and stabilize the rent roll. In-place leases have a WALT of 4.5 years anchoring strong projected total returns and a healthy cash yield. This purchase includes a 0.73-acre adjacent land parcel on the hard corner of an excellent intersection. The 0.73 acre track currently houses a decommissioned multi-lane drive through banking facility. This surplus land is ideal for future vertical ground up development, as well as an immediate low-cost redevelopment into an amenity for the existing office building.
These two investments were our last Fund III office investments in Houston. As mentioned in our last report, the Fund III Investment Committee and the Griffin Partners Investment Management Advisory Committee monitor capital allocations to ensure appropriate geographic diversification and avoid overexposure to any particular market, including Houston. With these latest investments, the Fund’s equity allocation to Houston office is approximately 29%, a comfortable allocation within a diversified portfolio of thirteen (13) assets across six (6) of the ten (10) target markets we cover.
As of December 2019, we have sold our first Fund III investment, Arapahoe Business Park and 345 Inverness in Denver, CO, a ten-building industrial flex portfolio that included two assets, purchased in May 2016. The asset produced a solid return considering our objectives were driven towards a stable cash yield as an initial investment for Fund III with a “value-add light” strategy.
Real Estate Market Conditions
As noted at the outset, investors have inquired about evolving office use trends and the implications on space demand. In prior quarterly reports, we have referred to how office density continues to rise and therefore less space is needed to house more employees. So, one should ask how does this continued densification impact the demand for office space, and how does this impact the overall value of office assets?
Our TEAM has completed a deep dive into why office densities have changed, and Kevin Ellis, an Acquisition Associate, has led the charge on providing the materials used in our understanding this topic and the discussion that follows.
First, Corporate America is doing everything in its power to save money on occupancy cost. A few key take-aways: the average cost of real estate per person is $6,680, of which 66% is rent and 34% is operating expenses, and across the U.S., most companies occupy less than 80% of their space. As the graphic on the next page depicts, the average square foot (SF) per employee fell from about 220 SF in 2010 to 195 SF in 2019. The graphic also shows what happens during times of overall expansion and downsizing in the US economy. For example, the 1990’s was an historic long-term expansion of the US economy and during that 10+ year time frame the number of employees per square feet started at 225 SF/employee around 1991 and by the early 2000’s just prior to the tech-wreck (US downturn), density dropped below 185 SF/employee. The same is now occurring since the Global Financial Crisis (GFC) in 2009 to today. Currently, we are inching closer to the previous record levels of overall employee density. There is a correlation between office density and economic expansions. Because office leases are generally set for 5 to 10-year periods, continued hiring during economic expansions leads office density to naturally increase. Conversely, continued layoffs during downturns means less workers are in the same office space so density decreases.
Another factor is the changing work force. As we all know Baby Boomers are not getting any younger, and the almost the entire generation will be over 65 in than 10 years. The largest cohort of the work force over the next ten years is Generation Y (Millennials). Gen Y will make up 40% of the work force over the next decade, and in 2030 the first millennials will be 50 years old! This work force is highly collaborative, and 71% say they’d prefer a work-life balance over a well-paid job. 88% of Gen Y wants to be able to choose where and when they work, but most still want to work in an office regularly and one-third of this generation state their environment is their top priority.
Further, Generation Z, currently the largest cohort in the world, with over 2 billion people (~26% of the population), was raised in the ever-present war or terror and post GFC economy. The table below from Pew Research Center depicts the US population by Age as of 2020.
Gen Z is likely to focus more on security and stability than Gen Y, with less interest in entrepreneurship. They are the first generation to grow up entirely in a digital world. Many lack experience building social skills and struggle with social anxiety. I think none of us would be surprised to learn that almost 40% of Gen Z say they are concerned technology has damaged their interpersonal skills. Duh, we see this all the time, kids today (ages 10 to 17+) sitting in a public group setting, and ALL of them are staring at their phones….with no real social interaction!
So, on that note, Gen Z is likely to be less socially oriented than Gen Y with a tendency to control their own workspace and create a wall around themselves regardless of how “open” the office plan may be. They are simply less interactive. The key take away is Gen Z is less “socially collaborative” and more likely to be “technologically collaborative”. For example, according to a Harvard Business Review article published in Nov-Dec 2019 issue, “Gen Z” creates “…..a Fourth Wall, and their colleagues come to respect this. If someone is working intently, people don’t interrupt. If someone starts a conversation and a colleague shoots him a look of annoyance, he won’t do it again. Especially in open spaces, fourth-wall norms spread quickly.”
So, what does all this mean for a changing work environment? The table nearby shows that the new generation of workersprefer using flexible office space or to work from home or “anywhere” vs. working a permanent office. On the flip side, the emerging consensus, supported by recent research, is that open plans (flexible office space) are detrimental to productivity, primarily by failing to create more “social collaboration” but instead driving more “technology collaboration.” As recent studies indicate, 70% less face to face interaction occurs and there is a 50% increase in email communication. Wow! Very interesting and counter to the prevailing narrative. The sensory overload of open offices seems to trigger a withdrawal response where workers crave less interaction, creating this “Fourth Wall”. Further, the constant audience creates the pressure to always look busy and in turn lowers work productivity. A specific example is employees in open office concepts take 62% more sick days than employees with their own office. Corporate America and business owners watching their bottom line will not tolerate this forever, and the space planning pendulum will swing back towards more available areas of privacy. Open concept plans have proven to decrease attention spans, creative thinking, and job satisfaction. The upshot is it may “look cool”, but it doesn’t work…..for employees or employers!
Taking this one step further, how has this densification effected overall office real estate trends? According to Newmark Knight Frank in a research piece called “The Future of Commercial Real Estate”, in the 12 largest metros average transactions under 10,000 square feet have decreased annually since 2016, with average leasing volumes moving from approximately 1,500 leases in 2016 completed to just under 900 leases completed in 2019. This single statistic can take on several different meanings; the economy may be slowing down for overall small business owners, densification is a continuing trend, and most importantly office owners need to adapt their investments to create workplaces that tenants are seeking. The “Tighter Quarters” table (next page) from Transwestern shows respondence surveyed believe densification will increase in 2020.
This continued slowdown in the volume of signed leases has spurred office owners to spend up front capital in order to lure new and existing tenants to their spaces. One of the most apparent manifestations of this spending is the “amenity race” we are seeing across the office sector. This new amenity standard was also ignited by the high- end workplaces offered by coworking firms. These coworking firms opened the door for conventional companies to access amazing workspaces which were previously for the who’s who list in either SoCal, lower Manhattan, or the hip North Loop area of Chicago; not anymore! This amenity race has significantly increased tenants’ expectations of the workspace, setting new “bars” (pun intended) for Landlords. Couple this expectation with rising labor costs, and it is no surprise we have seen significantly higher Tenant Improvement Allowances (TI’s). Per Newmark Knight Frank “The Future of Commercial Real Estate”, across nine major cities average TI’s increased from about $35psf in 2009 to almost $68psf in 2019, that is a drastic increase!
It’s clear that the pendulum has swung too far toward more densification and in turn “open-space” plans. As studies have proven, densification backfires, and owners and tenants (large and small) will move to something in-between fully open office concepts and the traditional office layouts (offices with walls). As corporate America is fighting for talent through the “amenity” and “densification” race, they will now need to employ a balancing act that gives employees personal space to concentrate and work productively, while maintaining the “cool factor”.
As we’ve seen in times of economic downturn, employee densification reverses (circa 1991 or 2000) as the number of employees is less as a result of layoffs while longer dated lease obligations take some time to adjust. What’s clearly evident now is the leverage is with the employees because of the on-going economic expansion, but this will shift back to employers in the next economic downturn. So the best conclusion from the data and our experiences as a Landlord is, we should continue to provide amenities (we’ve jumped into the “amenities race”) and do our best to stay in the middle of the densification pendulum in order to retain long term occupancy for our investments.
The Wuhan Woes
COVID-19 (coronavirus) has dominated the news of late, and fears of it have devastated equity oriented financial assets worldwide for several days as we are going to press. Various statistics such as energy consumption and travel paint a picture of a Chinese economy that is clearly buckling under the strain. How quickly China’s economy can return to normal, and how much impact the disruption will have on Q1 and annual growth for 2020 are uncertain. China’s economy was slowing prior to the pandemic.
Does it matter? In 2003 when the SARS epidemic emanated from China, the proportion of world economic output attributable to the Chinese economy was considerably smaller than it is now. Since then, China’s economy has rocketed to the second largest, far ahead of number three Japan. See accompanying chart. Could there be financial or economic contagion if China suffers a severe downturn? According to Wells Fargo, foreigners own about $400 billion worth of dollar denominated Chinese bonds. Foreign banks hold loans to Chinese households, businesses and governments which when combined with the dollar bond exposure shows that China’s external debt currently totals roughly $2 trillion, up from $1.3 trillion three years ago. The external debt of Chinese banks accounts for nearly one-half of the total.
While $2 trillion seems significant, China’s external debt is considerably smaller than the United Kingdom ($8 trillion), Germany and France (~ $6 trillion each), and the U S (nearly $20 trillion) and is a relatively low and manageable 14% of GDP, well below the 50% threshold generally considered to be worrisome. Further, thanks in large part to capital controls, the $2 trillion is diversely held with no important foreign economies having excessive exposure. Despite what appears to be a manageable amount of external debt, many economists are asking what might happen to the global financial system if China defaulted on a major portion of this external debt. Notably, there has been a rise in defaults on internal debt shown in the nearby chart.
Most of the sober economists we have read on the subject believe a major crisis in China, while consequential internally to China, would not likely have extensive direct financial effects on other countries, but more likely would have meaningful indirect effects on other global economies. Wells Fargo: “…… a financial meltdown in China would probably cause a painful economic downturn in {China}, which would impart a significant shock to global growth via the exports that China takes in from the rest of the world.” Hardest hit would likely be the industrial elements of the Eurozone, particularly in Germany, which is the most exposed to China with roughly 3% of GDP exported to China.
Large multi-national companies with significant supply chain disruptions as well as sales in China are certainly going to be negatively impacted. If one were looking for black swans, it would not hurt to consider whether the impact of COVID-19 might break the back of the camel that is the bloated and teetering BBB corporate credit market.
What are the odds of an internal crisis in China? Part of the answer must start with an examination of how China grew so large, so fast. While China’s long-term demographics will certainly present problems in the coming decades, the untapped productive potential of its massive population has been the biggest source of explosive growth since Deng Xiaoping and his likeminded reformists unleashed a “socialist market economy” in December 1978. However, looking back at the chart on the previous page and observing the parabolic growth experienced by China, it is hard to imagine that demographics alone could account for this unprecedented growth rate. Indeed, there is another factor, debt. In the nearby chart, while all of the lines are worrisome in dimensional terms, there is one line that stands out. The growth rate of total debt in China is as unprecedented as the economic growth rate.
Examining the areas of major global economic activity most at risk for contagion, the Eurozone stands out. German industrial activity has been contracting for several quarters, led by a severe slump in the auto business of a magnitude reminiscent of the global financial crisis (GFC) in 2008-2009. The nearby chart of German auto production needs no explanation. While there are likely many contributing factors to the fall of German industrial might, one must consider the central role of its dominant auto industry. According to Statista, Global auto sales peaked in 2017 at 79.6 million units and have been gradually declining since. The forecast for 2020 is 74.1 million units. Demand for cars is colliding with environmental reservations, changing generational preferences, energy transitions, advances in technology, urbanization and demographic changes, all of which are long term factors which will not resolve themselves for some time. Coupled with a rise in China’s internal production of vehicles, Germany’s exports of cars and industrial machinery to China may never return to its previous peak. It is likely that the implications of this secular decline in the global auto industry are not yet well understood by economic policy makers.
US growth was already slowing prior to the outbreak. Despite the positive headline jobs number in January of 225,000 new non-farm payroll jobs, the historical revisions erased almost 500,000 previously “counted” new jobs, eliminating a large part of the late 2018 surge in jobs. (Perhaps a diatribe for another day, but virtually all the major economic statistics prevalent in every economic discussion – GDP, inflation, unemployment, etc. – are imprecise estimates!) Like the Eurozone, industrial elements of the US economy have been week, offset by what has been to date, strong consumer metrics. Unsurprisingly then, cyclical parts of the US labor market have been weak, displaying falling rates of growth. Service sectors such as education and health are growing strongly, up 2.6% year over year through January, and are a large enough component of the overall labor pool that they are boosting the growth rate for total employment. Interestingly, education and health service jobs have not declined on a year over year basis for over three decades. One of the economists we follow examined what overall employment growth looks like if you remove education and health service jobs. Result, the rate at which total non-education / health care jobs is growing has been in secular decline since 2014, falling to a rate in January of just 1.1% year over year (nearby chart).
There are a few other concerning elements of the January US jobs report that belie the good headline number. Most notably in our opinion, because it underpins the strong consumer who has buoyed overall economic activity, the growth rate in total hours worked has fallen to a level not seen since the US emerged from the GFC in 2010. See chart on previous page. If this particular growth rate continues to decelerate, the robust consumer support to US growth will begin to evaporate.
What do the smart guys think about the likely COVID-19 impact on the US economy…..precisely. (In their defense, the following figures were published 10 days prior to our publication and do not reflect the recent pandemic panic…which may actually make the them more useful!) Goldman Sachs Global Investment Research has studied the impact on US and global growth rates associated with past disease epidemics, identifying weaker growth of up to 1% in the quarter of the pandemic peak, followed by a rebound the next two quarters. Goldman is estimating a 0.8% reduction in US annualized growth in Q1, and a rebound impact of approximately 0.3% in Q2, 0.4% in Q3. On balance, Goldman believes that cumulative net effect on the annual GDP would be minimal; however, “the risks are clearly skewed to the downside until the outbreak is contained.”
Subsequent to the publication of Goldman’s estimates above, the markets, especially the bond market have priced in those downside risks Goldman cautions of and may continue to press that pricing further. The yield curve has flattened considerably and some portions of it are again inverted.
Interest Rates
As a response to pandemic driven effects on global growth, and in part due to the long end of the yield curve falling precipitously, many pundits are crying out for more monetary and fiscal stimulus. As if there wasn’t enough of that already!The problem with both those policy levers is they transmit their effects to the real economy primarily through higher levels
of debt, and the world already has too much debt (see chart, also the % of GDP chart two pages prior). Count us firmly in the camp that believes excessive debt serves only to lower FUTURE growth rates for a handful of reasons, the most significant of which is by pulling future demand forward to the present. For a generation we have lived in a world where the future demand being pulled forward was the “next” decade’s demand…. or even the decade after that. But as the debt has ballooned, the date the piper must be paid draws more near and in all likelihood is almost upon us. For the past decade, the day of reckoning has been postponed by having the world’s major central banks absorb a significant portion of the debt by bringing it onto their balance sheets. The Federal Reserve’s balance sheet, at $4.1 trillion, is now over $300 billion larger than it was in September 2019. So even though the Fed has stopped lowering its short- term policy rate, it has been substantially easing monetary conditions by purchasing Treasury-bills. The Fed claims it will stop this debt monetization in the spring, but there are many who doubt it will be able to do so. Some economists suggest there is no reason not to monetize the debt since the huge balance sheet expansions over the past decade have yet to produce evidence of meaningful inflation. A version of this argument is called Modern Monetary Theory (MMT). Our view of MMT is that it is bunk, and the excessive amounts of debt will eventually have to be repriced. For those who hold the debt as an asset, that repricing will be very painful. Some politicians like MMT because it is a free lunch. We don’t believe in free lunches.
In addition to pulling demand forward, the productivity of debt continues to decline. The last chart this quarter is one we first brought to our readers a few years ago. Regrettably, it appears to be an inexorable long-term trend showing no signs of reversal. The productivity of debt in terms of how much GDP growth is achieved by incurring additional units of debt continues to decline across all major economies. And guess whose economy has suffered the greatest decline in debt productivity? Bonus points if you guessed China!
If populations in the major economies where the lion’s share of the debt resides were expanding, then the whole issue might be less concerning, but the population in aggregate across the developed world is growing slowly, and at a decelerating rate and is even declining in several
large countries (read Japan). The result, per capita debt keeps growing at an accelerating rate. Eventually there will be a “repricing.”