It’s been a hot summer across Texas; we hope you’ve been able to travel to higher ground to beat the heat with family and friends. As expected, inflation is (thankfully) starting to cool, although our house view is there will be some time before we reach the Fed’s target of 2.0% on its preferred measure of inflation.
This quarterly report will touch upon various elements of commercial real estate (“CRE”) market conditions ranging from construction costs, office vacancy, and industrial demand to the debt markets. We also provide our assessment of macro-economic conditions and their presumed impact on interest rates.
As mentioned last quarter, we had hoped to lock in a one or two hedge instruments on cash flowing assets but as we stated “….the hedge market is extremely volatile week to week, day to day, depending on various factors as relates to the looming debt ceiling talks, Fed reserve comments, Fed impending meeting in early June, etc, etc… “ Sure enough, the Fed moved rates another quarter point in mid-July and hinted at possible further increases. Pricing and the value of the term to hedge didn’t make sense, so we did not put any further hedges in place. We did some extensive analysis and concluded the two assets in Fund III which are unhedged have substantial cash flow with limited lease rollover and should therefore still cover debt service even if interest rates rise another 200bps. Good news.
See the Table of Contents below to assist with navigating to a preferred section or getting a quick general take.
- Fund Updates: High level news on Fund activity.
- Real Estate Market Conditions: In this section, we will review:
- Construction Pricing stabilizing
- Unpacking Office vacancies
- Office investing today, sharpshooting
- CRE Debt, continued volatility, and piles of debt outstanding, $3T!
- Industrial fundamentals, positive, but nowhere near 2021 or 2022 levels
- Macro Economic Conditions:
- When does interest rate risk become credit risk?
- Is the Fed trying to finally kill the Greenspan “Put?”
- No landing! Really?
- Labor and spending star, but can they endure?
- Inflation hangs around but may be headed for the door.
Fund Updates
Fund III:
As indicated last quarter, we’ve marketed for sale “The Oaks”, a three building, single-story flex industrial set of assets within Fund III & Fund IV portfolio located in Charlotte, NC. The process is continuing, and the TEAM has received Investment Committee approval to sell prior to year-end.
During this quarter, we completed the refinancing and extension of term for two of Fund III’s office assets. Given how difficult and challenging the loan extension process has become for office assets, we are quite pleased with the outcome.
Fund IV:
As mentioned above, the sale process for the “The Oaks” is continuing, potentially providing realizations for both Fund III and Fund IV. Further, this quarter the TEAM secured a 10+/- acre land parcel in North Houston to develop a spec front-load 139,000+/- SF industrial building. We received Fund IV Investment Committee approval to proceed with capitalizing the project and have since secured both debt and equity via existing Griffin Partners relationships. We will provide more details in our next quarterly report.
Real Estate Market Conditions
If you’ve read the last several quarterly reports, you know we continue to provide brief observations on current commercial real estate (“CRE”) market conditions, which we call Griffin Partners Brief Takes:
Construction pricing stabilizing
- Construction pricing for all CRE asset classes skyrocketed over the last 2+ years, but the rate hikes by the Fed since early 2022 have slowed new construction activity and provided supply chains a breather. Per a recent blog from Alston Construction “the severe shortages experienced during the pandemic” have slowed and “materials are now more readily available today.” Two of the three main components in constructing industrial projects, roofing and steel, have now stabilized. Alston has seen “greater reliability of materials and pricing has normalized although pricing remains higher than two years ago.” Electrical components remain difficult to come by due to the large increase in new projects during the last 24 months. This has led to “extended lead times of 12 to 14 months for many electrical components” according to Alston. Taken as a whole, this is positive news from a macro level as one of the keys to an “economic soft landing” according to CBRE’s Global Capital Market Condition June 2023 report is for the “supply chain pressures and commodity prices continuing to ease”
“Office Vacancy Unpacked” or “The haves vs. the have nots”
- The most recent vacancy reports across the US show vacancies in the office sector remain at elevated levels. Costar Analytics reports national office vacancies as of the midpoint of 2023 hit a record high of 13.2%, 370 basis points higher than at the end of 2019. No real surprise on that front, but if we dig a bit deeper to understand the data several important details emerge. As we’ve mentioned in past reports, general vacancy data is an important metric, although we’ve all understood that office obsolescence was continuing to skew the overall office vacancy percentages. In short, aging office buildings (circa 1980s and early-1990’s) coupled with limited new supply have distorted overall availability rates across our target markets. We have chronicled for several quarters the progression of obsolescence driving office vacancies resulting in a meaningful portion (20% to 30% in our estimation) which will remain largely vacant. COVID accelerated this obsolescence trend and the empirical data if you look closely shows “the haves vs. the have nots”. Our friends at JLL landlord leasing have dug deeper to understand where vacancy is concentrated as well as the vintage of the product. See the nearby graphic detailing JLL’s findings.
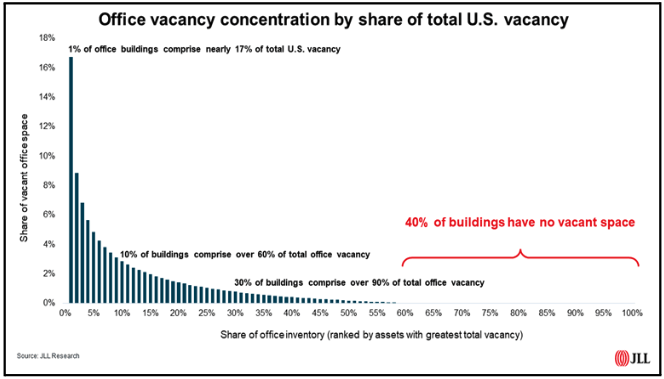
A few take-aways from JLL regarding the above graphic:
- Despite record office vacancy rates nationally, disjointed performance since 2020 has driven the older-vintage “commodity” segment of the office market to bear an outsized proportion of impact – today, 30% of existing office buildings comprise more than 90% of total vacancy on the market.
- Offices built in the 1980s and 1990s have been particularly impacted by the pandemic and cyclical headwinds of 2022, comprising more than 50% of the new vacancies that have emerged since 2020, despite comprising less than 40% of total office inventory.
- With underperformance concentrated in a smaller subset of buildings, quality segments of the market have performed well despite broader challenges: vacant space in offices developed between 2010-2019 has declined by 5% since the end of 2019.
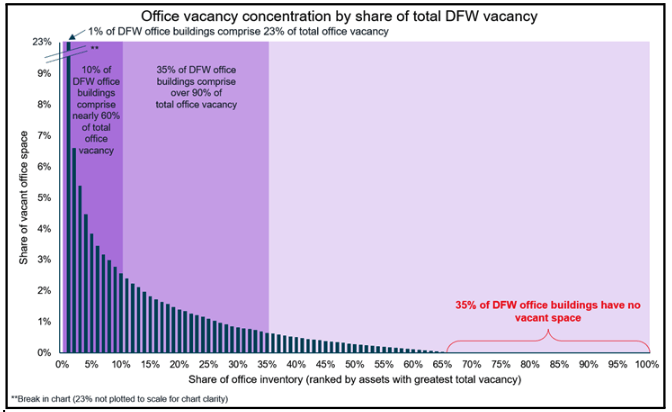
Drilling down to a particular target market, we continue to observe micro vacancy trends in each of our markets as well as recognize the vacancy concentration levels relative to product that are investable. The following graphic from JLL landlord leasing Team unpacks the Dallas-Fort Worth (DFW) market vacancy concentration (similar results as the US graph above).
Money tides are moving
Institutional investors have always allocated monies to CRE; however, they are mostly on the sidelines for now but remain convicted to committing capital to CRE through the next cycle. Private equity is leaning in although not filling “the gap” from prior years. Quarter over quarter volume is down. As we referenced last quarter “the Fed moving rates has slowed capital flows” and due to this, capital flows from institutional investors have come to a crawl. A few stats and takeaways:
- As of 1Q23 Private Equity has closed over 660 transactions in North America (per Preqin). This is a 25% decline compared to prior quarters and 51% decline compared to same period the year before. It was also half of the quarterly average for the past five years.
- Per CoStar’s most recent quarterly report, total sales volume of property purchases by private equity in 1Q23 totaled $4.9 billion. This transaction trade amount is $500 million less than the first full quarter following the coronavirus pandemic in March 2020. See below the CoStar table detailing US Private Equity Property transactions as of 1Q23.

The follow are a few take-aways from JLL on DFW’s office sector vacancy:
- Almost identical to the US, bifurcation since 2020 has driven the older-vintage “commodity” segment of the office market to bear an outsized proportion of impact.
- Today, 90% of DFW’s office vacancies are concentrated in 35% of existing office buildings.
- 60% of the DFW office vacancies are concentrated in 10% of buildings.
- Of this 35% of office inventory, over 50% is located in the Far North Dallas, Las Colinas, and LBJ Freeway submarkets.
- Another 35% of office assets in DFW have no vacant space at all.
- With underperformance concentrated in a smaller subset of buildings, quality segments of the market have performed well despite broader challenges: vacant space in offices developed between 2010-2019 continues to be below 10%.
Lastly, as we look to carefully invest in office projects over the remaining term of Fund IV’s investment period, we will continue to focus on historical occupancy, vintage, functionality, and locations. As JLL states for the new product (e.g. functional product) vacancies continue to remain below 10%.
Transactional-ist, no, Sharpshooter
- GreenStreet recently interviewed Lisa Picard, former CEO of EQ office, a Blackstone portfolio company, and she mentioned how investors should consider investing in office today. It was refreshing as well as a reminder of our convictions if and when we invest in office real estate. Ms. Picard stated:
- “Location remains key to an asset’s success and…. office buildings with residential adjacency and/or a mixed-use neighborhood environment will perform the best, and that those employees wanting to grow their careers and benefit from having their fingers on the pulse of organizational decision making will want to be in the office.”
- “Investors…can’t be a “transactional-ist” and she further stated “successful investor(s) will need to take a sharpshooter approach, with a focus on asset management and operations. This is reinforced by the tenant flight to quality, which has allowed higher quality office properties to generate more than their fair share of office leasing activity.”
- We couldn’t agree more with Ms. Picard’s comments, as you will see within our existing portfolio of remaining Fund III assets and more recently acquired Fund IV assets, we continued to remain hyper focused on asset management and operations to stabilize leasing. Our focus is on investing within suburban and/or urban areas with strong in-fill location attributes (“residential adjacency and/or mixed-use neighborhood environment”). Our latest office investment in Fund IV, Roxborough I &II fits this exact profile within the high-end South Park submarket of Charlotte; the project boasts an above industry standard rating of “very walkable”.
You’re asking us to pay?
- As summarized last quarter, the regional banking community is the most “illiquid lender profile (type) in the market”. Now, to boot, “property owners are asking their banks or other loan-holders to provide capital to cover leasing costs and other basic upkeep” according to the latest article from Commercial Mortgage Alert (Aug-23). If a borrower 1) is tapped out on “good news” monies and 2) the additional investment by the equity participants will not garner any value back to the original investment, borrowers are inclined to not provide new capital if they think “it’s good money after bad”. At that point, borrowers have no other choice but to ask their lender for capital regardless of whether or not the borrower is in default and/or approaching the loan maturity. This circumstance is particularly acute for office properties.
- Lenders are often reluctant to foreclose on their CRE collateral as this creates a host of issues for lenders’ balance sheets and regulatory ratings as well as the asset’s operational risk which is outside the lenders’ expertise. If a lender is confident the operator / equity sponsor is best placed and properly incentivized to continue operating the property, then lenders will typically extend loan maturities. Because a much smaller proportion of loans are being repaid, CRE loans held by lenders have ballooned (see next brief-take).
Debt, debt and more debt
- In a recent article published by GlobeStreet by Erik Sherman (Aug-23), data from the Federal Deposit Insurance Corporation (“FDIC”) and the Mortgage Bankers Association (“MBA”) show a puzzling statistic indicating “…. more than $3 trillion in outstanding loans, but commercial and multifamily loan originations are down 53% year-over-year in Q2, although up 23% in 2Q2023”. The upshot, per our comments above in the previous brief-take, lenders are not receiving the volume of pay-offs for existing CRE loans and borrowers are receiving short term extensions. Further, lenders are continuing to press into CRE per MBA comments that volume is up by “23% in 2Q23” although from a historic trough in lending.
- In a recent meeting with one of our largest Texas relationship banks, their head of CRE lending for Texas stated “…. turnover or payoffs have generally averaged 35% per annum, we were down to less than 5% in 2022 although that has increased slightly in 1Q2023”.
- The MBA stated: “….loan dollar volumes decreased by 69%, year over year” and originations for all major property types decreased by “74%….with a decrease in the dollar volume of loans for health care, 66% for office properties, 55% decrease for retail, 55% for industrial, 48% for multifamily and 32% for hotel properties” the report stated. The good news is banks equity capital and reserves (Tier 1 Capital) are in good standing from a historical perspective. In the chart nearby tracking FDIC insured institutions, we can see these capital ratios (light blue line) are more robust, meaning the banks are considerably less leveraged than during the Global Financial Crisis (“GFC”). The healthier bank environment is confirmed in CBRE’s Global Capital Market Condition report from June 2023, which observes: “….continued volatility in the banking sector….[but] we do not expect bank distress to approach levels seen during the GFC.”

So yes, whatever goes up, comes down. We are beginning to see the Industrial sector “normalize” from all-time highs. Per Green Street’s Aug-23 Industrial Sector Update the following are a few takeaways:
- Tenant demand has leveled off.
- U.S. new supply is forecasted to exceed demand by 225 msf in 2023, pushing vacancy to increase 130bps this year, to a still low, 4.4%.
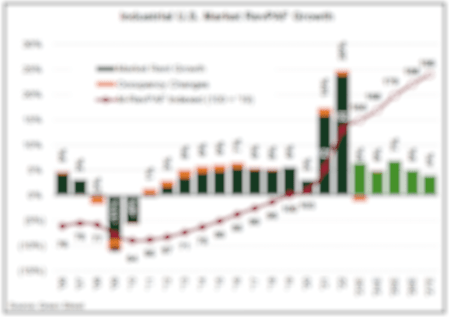
- Market rent growth is decelerating faster than expected (across all Industrial types)
- Cap rates are unchanged but are up 80 bps from the historic lows (1Q22) ~ 7% lower values.
- Net Asset Values are up 3%+/- on average due to NOI growth.
- Transaction volume is down as of 2Q23 ~ 40% year-over-year.
Click here to request the full Q2 2023 Report.
Macro-Economic Conditions
Two quick side notes first, then some more traditional economic analysis topics.
When does interest rate risk become credit risk?
In last quarter’s report, and in the Real Estate Market Conditions segment above, we examine the related dynamics of tightening bank lending standards and lower loan origination volumes. While researching these conditions, it occurred to us that they are likely not independent of the interest rate cycle. Not necessarily a cause and effect in either direction, but perhaps correlated. So, we ran the nearby chart from the St. Louis Fed (FRED) to see if any correlation could be observed. Sure enough, there appears to be a meaningful correlation, with the Effective Fed Funds rate leading Credit Tightening Standards by a quarter or two, except for the most recent cycle when standards became tighter before rates started to rise. Intuitively this makes sense for several reasons including the expected decline in a borrower’s ability to cover interest expense as rates rise if the borrower is exposed to floating rates or needs to roll over maturing debt in the higher rate environment. At some point, interest rate risk does become credit risk, and the resulting drop in overall liquidity becomes a significant headwind to the economy. Where is that point? While we don’t have a fancy empirical model to spit out a number, a visual observation of the graph above might lead one to conclude that we may be close to it.

Is the Fed trying to finally kill the Greenspan “Put?”
More mature readers will recall that Alan Greenspan took over from Paul Volker as Chairman of the Federal Reserve in 1987 and served in that role a lengthy 19 years. During his tenure, some market observers thought they noticed a pattern in which the Fed would lower rates if equity market conditions got too depressed. They labeled the patter the “Greenspan Put.”

Perhaps the sentiment got started when a few months into his term, the 1987 stock market crash occurred with equity prices declining almost 25% in one day. Interestingly, the Fed only lowered rates from 7.25% to 6.75% in response to the 1987 crash. While the Fed may take equity market conditions into its broad view of overall financial conditions, our view is that the Fed, including during Greenspan’s tenure, is largely influenced by other economic factors to include inflation, inflation expectations, labor market conditions, productivity and long-term potential GDP growth rates. We used Macro Trends to run a graph, which can be found nearby, to see if any evidence of the Put could be found. The graph compares the trailing six month change in the S&P 500 with the Fed Funds rate. There are four periods (red circles) outside of recessions where the Fed lowered short term rates at a time corresponding to declines in the S&P 500. There are so many other factors that could be influencing both equity valuations and Fed policy decisions that it is hard to draw any conclusions, especially given that the rate changes each of the four times were not very significant. Regardless, in some circles the notion of the Put still lingers. If the Fed is trying to drive a stake into the heart of the Put sentiment during this cycle, then we can expect higher short-term rates for a longer period, feeding the higher for longer narrative which is building in the financial press.
No landing! Really?
Recent talk among the chattering class of economists and market pundits reveals a rising proportion of opinion that the U.S. will avoid recession with the Fed engineering a “soft landing.” One of many recent postings suggesting this optimal outcome can be found here. In our view, outside of the deceptively tight labor market (more below) and relatively robust consumer spending, virtually all indicators point down. The Leading Economic Index (LEI), compiled and published by The Conference Board, fell for the 16th month in a row in July, a pattern wholly consistent with an impending recession. The LEI fell 0.4% in July and is now roughly 5% below its pre-pandemic level. It is worth noting that the July decline is the smallest monthly drop in 11 months, perhaps signaling some resilience.

Yet the economy keeps growing. Q2-2023 revised GDP real growth was 2.1%. Is economic growth so strong that it is overcoming restrictive monetary policy or was there so much stimulative monetary policy (and fiscal policy) for so long that it is simply taking time for restrictive monetary policy to slow the momentum.

Nothing technical here, but just looking at the nearby graph of 10-year real swap rates, it seems like the party lasted pretty long (3 years) and got kind of wild (18 months of real LT rates bumping around negative 1.5%). Then the Fed finally removed the punch bowl about a year ago so we all went home. Perhaps there will be a hangover when we wake up later this morning………..
Labor and spending star, but can they endure?
Every soft landing discussion includes superlatives about the strength of the labor market. However, there are some concerning trends which are sometimes overlooked. The rate of job gains is in a clear downward trend, and as in past cycles, such a sustained downward trend will eventually cross the zero bound.

Our admittedly crude calculation of the timing for job growth to turn negative is Q2 of 2024, as can be seen in the nearby chart. Also, the revisions to the BLS’s monthly job growth estimates have been negative for six straight months. Such a string of net negative payroll revisions turns out to be a pretty good indicator of looming recessions. EPB Macro Research has a good chart, reproduced nearby, showing trailing 12-month average revisions and how when that figure goes negative, recessions have followed close behind. Additionally, recent BLS revisions have indicated a shift with full-time jobs actually declining, but part-time jobs making up the gap, plus a little. We don’t have any research adding meaning to that trend, but it doesn’t feel good.

While the ECI continued to trend down in Q2-2023, it remains above what Wells Fargo economists estimate to be the range consistent with 2% inflation. Wells Fargo estimates that optimal range for the ECI should be between 3.0% and 2.5%. As can be seen in the nearby chart, Q2 ECI came in at 4.1% annualized and 4.5% year-over-year. That figure, along with the core PCE deflator which seems somewhat stuck in the low 4% range supports the higher for longer narrative.


Inflation hangs around but may be headed for the door
Most of the widely tracked inflation statistics, including those relied upon by the Fed, indicate inflation is trending in the right direction but remains roughly two percentage points above the Fed’s target of 2% and by some measures may be stalled out at that rate. “Sticky” is what the pundits call it. There are however some interesting alternative measures worth observing, and they may give a better glimpse into the near-term direction of inflation.
We were recently pointed to a very interesting website called Trueflation. Very interesting alternative perspective, although our enthusiasm may admittedly be an indication of our bias. Confirmation bias they call it. From the website: “Trueflation offers a more reliable view of inflation, contrasting with government metrics that have outdated methodologies and limited transparency. With over 10 million data points, it updates daily and has a dynamic methodology that responds to global market conditions.” We show a screen shot of a recent day from the site nearby.

The current inflation rate purported to be “real time” by Trueflation is 2.7%, a good 1%+ below CPI and 1.5% below recent PCE measures. It is notable that the Trueflation rate has ticked up a hair over the last few weeks. Probably reflecting higher gas prices.
Last quarter and Q4-2022 we harped on the delayed impact of shelter costs in the official inflation figures, and we showed a couple of charts illustrating what CPI would look like if it factored in real time shelter costs. Both indicated inflation much lower than the standard measures and already within the Fed’s target range. We did a little digging to learn more about from where most of the real time rent data was coming. Turns out there is an index published by the BLS called the New Tenant Repeat Rent (NTRR) Index, developed by Brian Adams, Lara Loewenstein, Hugh Montag, and Randal J. Verbrugge. According to Apricitas Economics, it “uses the same underlying microdata as the CPI to look at price changes for only the subset of units where new tenants have signed leases. That gives a much better picture of where the housing market is right now, and by proxy where official rent inflation is headed. Critically, the NTRR tends to lead the official CPI rent components by one year—and right now, it is saying we should expect significant disinflation over the next three quarters.” Its data are “strongly corroborated by ……. comparable private-sector data [such as] the Zillow Observed Rent Index and Apartment List’s Median New Lease estimates…”
Moody’s Analytics: “Year-over-year growth in the NTRR Index peaked at nearly 13% during the first half of 2022 but has since fallen to slightly negative territory in the first quarter of 2023. This is key, as past research by the Cleveland Fed has found that the NTRR Index typically front runs the official BLS rent inflation by four quarters. Moreover, the NTRR index suggests that the rent gap that opened between new and all tenants during the past two years has fully closed.” The nearby chart from Apricitas Economics illustrates the dramatic movements in the NTRR Index.

Last thought on inflation – The year-over-year comparisons may be a little challenged for the balance of this year as there was a leveling off of inflation in the latter part of 2022. We believe some of the conditions we discuss above will be sufficient to maintain the declining trend in inflation, but we acknowledge that the comparisons will be less favorable.
Conclusions
(Fed) probably done; maybe one and done, but higher for longer, until not, at which time the drop in rates is likely to be more pronounced than the gradual decline the market has priced in.