Finally, the Fed touched the brakes on the rapid rate hikes since March 2022, with just a 25-basis point increase in early May. This provided a bit of relief for overall market volatility and perhaps a signal that rates hikes may soon end. This quarterly report will touch upon a few items in the commercial real estate (CRE) markets which have slowed capital flows. The most recent quarterly data has been posted for us to provide evidence of what we anticipated would occur, a slowdown in transaction volume across the CRE sectors and data as to why. The YE 2022 empirical data has been scrubbed by the Griffin Partners TEAM, and this report will provide a few quick takes on our target markets. Lastly, the Fed’s recent slowdown in rate hikes has allowed hedging instrument pricing to normalize slightly in the near term, but the hedge market is extremely volatile. Hedging costs can be driven by various factors including the looming debt ceiling talks, Fed comments, bank failures, and economic data releases.
See the Table of Contents below to assist with navigating to a preferred section or getting a quick general take.
- Fund Updates: High level news on Fund activity.
- Real Estate Market Conditions: In this section, we will review:
- GP Brief-Takes: 1) Highlights of the current lending environment and a summary of current debt transaction volumes (they are way down!); a summary of what type of loans are closing and the associated spreads as of 1Q23. 2) A brief snip-it on why banks are not lending within this inflationary and interest rate environment; and 3) lastly, CRE trades are way down as of 1Q23, as institutional investors are largely on the sidelines. Although, it’s worth noting CRE is still attracting major capital to closed-end funds, and in this trough of trades, who is picking up the slack?
- After Brief-Takes we present our long overdue property clocks and market fundamental assessment, last published in 2Q21. We cover both Industrial and Office and general takeaways across a few select markets.
- Macro Economic Conditions:
- Will the widely anticipated “mild recession” actually materialize? Is a strong labor market and healthy consumer spending enough to overcome some more turbulent economic conditions under the surface?
- Headline inflation remains front and center, but are there changes in its composition that can provide clues to inflation’s future path?
Fund Updates
Fund III: Late in 1Q2023 we decided to test the market on selling the Charlotte, NC single-story flex product within both the Fund III and Fund IV portfolios. Due to strong leasing demand and the TEAM’s success in pushing rental rates and finalizing the business plan to reposition the assets, we are officially in the market with the newly rebranded “The Oaks”. The offering includes Scarlett Oak (Fund III asset) and English & Twin Oaks (Fund IV). We are optimistic a sale will occur in the 3rd quarter. Despite the difficult environment, we were able to complete a couple of loan extensions on office assets.
Fund IV: Near the end of the quarter, we agreed to terms to purchase an existing Limited Partner non-controlling equity interest in one of our Fund III assets at a significant discount primarily resulting from this LP’s need for liquidity.
Real Estate Market Conditions
The following are a few recent observations on current commercial real estate (“CRE”) market conditions coupled with a few pages of written material. First, our GP Brief Takes:
Debt Markets are locked up!
The lending community has been essentially frozen since the beginning of the year. There is a small glimmer of hope with transactions starting to occur, but the volume is well off previous quarters. In conversations with third party professionals and friends who assist us in our debt transactions, we continue to hear it’s extremely difficult to close any type of CRE loan in today’s environment. Some debt transactions are getting done, but it takes more than double the amount of time to capitalize (at least 90+ days) due to the magnifying glass of diligence on every metric within lender’s credit committees prior to consummating on either an existing asset or new construction loan.
The following are a few key takeaways from recent conversations with mortgage debt brokers:
- Most loans (>60% of transactions) that are closing in 1Q23 are fixed-rate products. Per our source, the strongest fixed-rate sector is Industrial. The average lender spread equated to just under 2.0% over the corresponding index (Term SOFR which is hovering around 5.0%)
- Floating rate bank loans are closing although it’s less than 40% of this firm’s book of business as of 1Q23. Average pricing for floating rate debt in the last 90 days has ranged from initially 3.85% over Term SOFR at the beginning of the year to 3.00% over Term SOFR over the last 30+ days, encouraging tightening. Further, bank loans are closing, but all are equal to or less than 50% LTV/LTC.
- Debt funds are extremely active and most of these loans are being priced with an average spread of 4.50% over TERM SOFR. Most, if not all, debt fund loans are executed with floating rate terms.
- Interestingly, per our 3rd party source, within the last 20 days, it’s the first time in 2023 that at least one deal in each respective CRE sector went under application to fund and close, outside of CMBS……..”it’s tough out there!”
- The regional banking community is the most illiquid lender profile in the market. Considering the upward pressure on interest rates, transactional volume has become very limited. As a result, loans are not getting paid off. We surveyed several of our relationship lenders on a new “shovel ready” industrial project in Austin for a new construction loan. Resounding answer was, “…thanks we’d love to lend to your team right now in that size range, but we are shut down for at least another 90+ days…” Thanks, but no thanks.
- The short answer as to why banks, in particular regionals, are not lending; they do not have an independent source of incoming cash, they are in the business of “recycling” capital. Per one of our trusted debt brokers “….most banks will make a loan (typically with a 3 year term + extensions) and once the loan is paid off, the bank will recycle the funds, to make a new loan. Without pay-offs, the system is now clogged, and any lending capacity is limited to essentially existing customers, if at all.”
- Borrowers don’t want to sell assets today unless they’re newly delivered and stabilized which carry a “premium” in today’s environment. Hence, the system is generally frozen for banks to recycle capital and if they have new liquidity, their strong preference is to lend to existing customers.
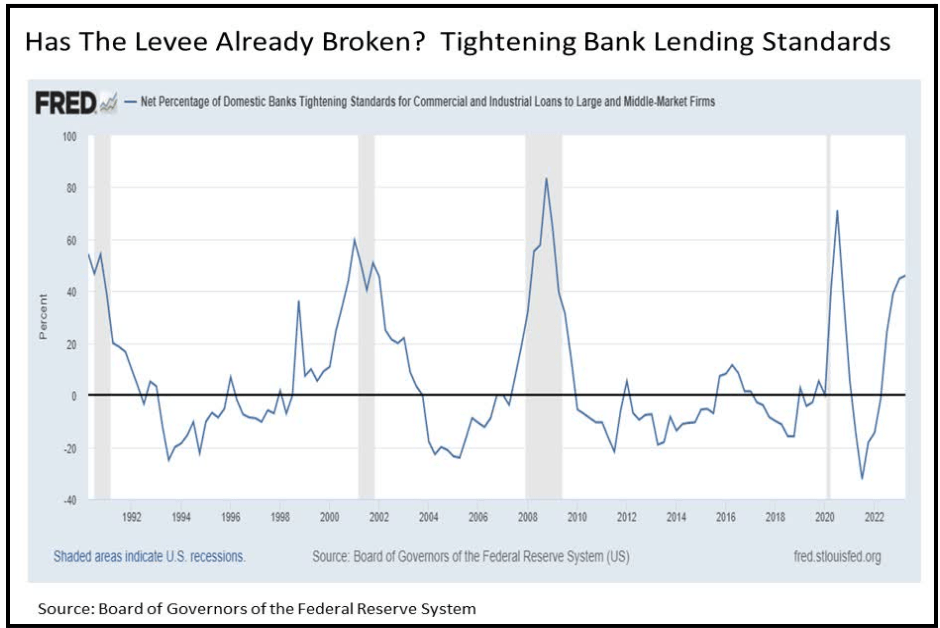
- Recently the Fed Reserve Board released the Senior Loan Officer Opinion Survey (SLOOS). This report provides a key metric which shows the Net Percentage of Domestic Banks Tightening Standards for Commercial and Industrial Loans. See the chart nearby dating back 30+ years. This chart measures the willingness (line declining) or lack thereof (rising line) of financial institutions to make commercial loans. The rising line on the far right of the chart doesn’t paint a very good picture for the lending environment over the rest of 2023. Per Eric Parnell, Chief Market Strategist, Great Valley Advisor Group “…today, bank lending standards are swiftly tightening, and they’ve tightened even further in the most recent quarter (1Q23). This suggests that an economic recession is likely starting in 2023 if we’re not already in a recession.” As financial institutions tightened their lending standards most of last year, loan originations decreased by 42% for 1Q2023 from 4Q2022, per CoStar News (May 10, 2023). Jamie Woodwell, MBA’s head of commercial real estate research stated “typically the first quarter is the quietest quarter of the year, borrowing and lending backed by Commercial and multifamily properties declined in the first quarter to the slowest pace since the first quarter of 2014.”
- Lastly, since banks are preserving capital for existing relationships, syndication desks are largely shutdown and banks are unwilling to fully underwrite loan positions that exceed their “hold position”. In turn, when a large loan is originated, greater than ~$35 million, the market participants are faced with having to “club up” several banks together to meet the total loan proceeds. This is extremely difficult to do at present, and in turn larger capitalization deals are struggling to close…a frequent comment we hear in the market today is “big is bad”.
Institutional investors have always allocated monies to CRE; however, they are mostly on the sidelines for now but remain convicted to committing capital to CRE through the next cycle. Private equity is leaning in although not filling “the gap” from prior years. Quarter over quarter volume is down. As we referenced last quarter “the Fed moving rates has slowed capital flows” and due to this, capital flows from institutional investors have come to a crawl. A few stats and takeaways:
- As of 1Q23 Private Equity has closed over 660 transactions in North America (per Preqin). This is a 25% decline compared to prior quarters and 51% decline compared to same period the year before. It was also half of the quarterly average for the past five years.
- Per CoStar’s most recent quarterly report, total sales volume of property purchases by private equity in 1Q23 totaled $4.9 billion. This transaction trade amount is $500 million less than the first full quarter following the coronavirus pandemic in March 2020. See below the CoStar table detailing US Private Equity Property transactions as of 1Q23.

- In research done by Clearwater Analytics, 200 institutional investors were asked whether the current economic environment and recent trouble in the banking sector would impact their alternative assets (Commercial Real Estate); 58% of the respondents said they expected no change or an increase in their appetite for the asset class.
- Total returns are still the apple of the institutional investor’s eye. Per WealthManagment.com research, institutions are increasingly committing their money to funds with value-add and opportunistic strategies. Further, those focusing on more niche real estate sectors and those planning to take advantage of distress opportunities in the market are generating the most interest. For example, Blackstone Real Estate Partners X, which closed their fund latest in April with $30.4 billion in commitments, is the largest real estate drawdown fund ever.
- Withstanding market volatility and overall fallout from the denominator effect, in the medium and long term CRE remains a highly attractive investment option for institutional players according to Weil.
Real Estate Market Conditions (continued)
It’s been over a year since we gave our readers insight into our semi-annual market fundamentals analysis. As a team we review CRE fundamentals within our ten target markets for both Office and Industrial sectors. To remind our readers, we gather data from various sources, including large national brokerages (JLL, CBRE, Cushman & Wakefield, etc.), commercial data gathering services to which we subscribe and pay fees for access, government statistics, and importantly from our own proprietary database to which we are constantly adding information about properties. On a semi-annual basis, our team reviews this market data and produces an assessment of the current conditions in each of our target office and industrial markets. A summary of our analysis for Industrial, compiled and condensed, is set forth in the table below along with a brief comment on our assessment as well as a color-coding for a “Strong Buy”, “Buy”, “Watch”, “Caution”, “Sell”.

As mentioned in the past, markets are invariably at different stages in the CRE cycle relative to each other at any given time. Similar to past reports, we’ve borrowed JLL’s illustration of these differences in a graphic called the “property clock”. For those that don’t remember or need a quick refresher on what the property clocks are, they provide a relatively easy way to understand visually where a particular market sits within the real estate cycle. Many firms use this standard four-phase cycle analysis, with some minor variations between firms. The four phases are rising, peaking, falling, and bottoming.
Below is the “Property Clock” detailing where we think each of our target Industrial markets stand within the cycle.

Both Charlotte and Raleigh are two of the top performing rent growth markets nationally, with rent growth of 24.2% and 22.7%, respectively, over the last twelve months according to JLL. Additionally, these two markets also have exhibited the lowest vacancy rates, with Charlotte leading the charge at 2.5% and Raleigh at 5.4% according to JLL. We would be remiss not to mention the performance of Nashville, where we currently have over two million square feet under construction, which posted an impressive 6.3% rent growth YOY, as well as a vacancy rate of 3.4%. While developers have taken notice of these three markets, future deliveries are limited due to high barriers to entry, scarcity of available sites, mitigation requirements, or a combination of all three!
As we mentioned in our 4Q-22 report, rising interest rates and inflation have increased development costs and have decreased profit expectations for potential new industrial projects. With continued rising inflationary and interest rate factors, new industrial development projects are significantly more difficult to capitalize. In turn, future supply over the next 24+ months will be limited. The graph below depicts how the number of new groundbreakings in the US continues to fall since 3Q-22, despite the historically low US vacancy rate of 3.8%.

Demand for industrial product is still healthy, and for markets where concerns of oversupply exist like Dallas and Phoenix, the slowdown of construction starts could be beneficial. Dallas continues to lead the US with space under construction reaching almost sixty-two (62) million square feet. However, the absorption continues to keep pace with construction with nearly thirty-seven (37) million square feet of absorption over 2022. Over 80% of all Dallas properties delivered in 2022 are already fully leased according to JLL, as occupier demand for space remained at an all-time high. Due to this high level of demand, Dallas has been able to maintain rent growth of 13.7% over the past twelve (12) months according to JLL.
Meanwhile, Phoenix also experienced rent growth of 25% over the past twelve (12) months, with space under construction reaching almost forty (40) million square feet. At the same time, net absorption over 2022 reached nearly thirty (30) million square feet. In contrast to Dallas, however, the amount of space under construction in Phoenix is nearly 12% of its total inventory, giving our TEAM pause about how the planned deliveries may disrupt demand going forward. As such, our TEAM has decided to “watch” the Phoenix market closely in the months to come.
On the opposite side of side of the coin, Houston and San Antonio have experienced some of the lowest amounts of space under construction when evaluated as a percentage of their total industrial market (5.7% and 2.2%, respectively). San Antonio’s vacancy continues to trend upward year-over-year and has room for improvement, although it posted strong rent growth of 14.9% over the last twelve (12) months. The vacancy in Houston continues to trend downward, while experiencing rent gains of 10% over the last twelve (12) months, and almost thirty (30) million square feet of absorption.
What will rent growth look like in the future for our target markets? Rental rates are expected to temper down to levels closer to the historical average. While 20+% rent growth year-over-year for the past couple of years was incredible, it’s simply not sustainable. As seen in the graph below, GreenStreet’s M-RevPAF forecast calls for compound annual growth of 6% over the next five years in the U.S industrial sector. M-RevPAF (Market Revenue per Available Foot) is a performance metric that combines effective market rents and occupancy into a single value that allows one to evaluate the health of a particular sector. Even with the backdrop of high inflation, higher interest rates, and other economic uncertainty, the industrial sector trajectory has remained positive across all indicators.
Click here to request the full Q3 2023 Report.


Nationally, office occupiers are beginning to exercise a higher degree of caution in leasing space in preparation for a possible economic slowdown. As shown by the graph below, this economic backdrop has led to leasing volume falling to 38.5 million square feet, the third quarterly decline since the Federal Reserve began its rate increasing posture in March of 2022. All of this is occurring in combination with markets experiencing reductions in tenants’ space requirements, along with a trend of occupiers moving from older, functionally obsolete office buildings to newer product.

Undeniably, the efforts to rein in inflation and mitigate bank crises have disrupted some of our office markets’ post-pandemic recoveries, but these recent cyclical impediments also serve to mask the U.S. office markets positive steps to recovery. Our TEAM constantly monitors the impacts of WFH on office demand. Our previous assessment was in our 2Q-2022 report. As the labor markets have begun to soften, and firms begin to focus more on productivity and efficiency, return-to-office efforts have begun to progress incrementally. The U.S. Department of Labor released data in late March indicating a decline in remote work during 2022: 72.5% of surveyed business stated that their employees rarely or never teleworked last year. This number is up from 60.1% of businesses who answered in the affirmative in 2021 and close to the 76.7% response pre-pandemic. Why is this important? While some businesses’ space needs requirements may be decreasing, it appears that employers are leveraging the somewhat looser labor market to counter the deteriorating productivity and collaboration they believe they saw with remote work over the past few years.
The following “Property Clock” details here how each of our Office markets stands within the current cycle.

Overall, we are seeing office-using employment continue to increase in our target markets, specifically in the Sunbelt markets we invest in (Houston, Dallas, Austin, Raleigh, etc.). The graph below from GreenStreet provides an excellent window into what we are seeing in our portfolio today as it relates to increased office usage. We have repeatedly opined that the suburban office markets in the Sunbelt continue to show better momentum than gateway/CBD markets.
As Cushman & Wakefield notes, reducing the tenant demand “analysis to purely a Class A vs. Class B/C discussion is no longer appropriate. These designations are too broad given the hyper-specific demands of occupiers”. Office occupiers continue to search for space in largely the same way as they did pre-pandemic.
Tenants largely want the following features in their search for office space: 1) Accessible location 2) Amenity-rich neighborhoods 3) Outdoor space 4) Wellness Amenities 5) Sustainability (i.e., efficient floorplates and air filtration), features which allow the building to outperform its competitors.
These trends are encouraging from our perspective as we continue to strive to satisfy occupier demand in our portfolio (most, if not all our office assets, were selected because they met the above criteria), as well as our pursuit to invest in assets that satisfy tenant demand and outperform their competitors.
Click here to request the full Q1 2023 Report.

Macro-Economic Conditions
The Invisible Recession
So, a mild recession, the widespread consensus prediction, has been “two quarters out” for the last four quarters. A majority of survey respondents believe the U.S. is already in a recession, although when digging a little deeper into the survey one finds that most respondents cannot identify the correct definition of a recession. Meanwhile, the labor market keeps chugging along, adding new jobs at a reasonably healthy pace every month. Headlines repeatedly say healthy consumer spending is holding up the economy. Are we heading into a mild recession in six months, or already in recession? Perhaps based on employment and spending we are in for a soft landing.Leading economic indicators have been declining in aggregate for eleven months, an historic lag between the downturn in leading and coincident indicators. Real Retail Sales, one of the more significant coincident indicators, is contracting at a 2.1% annualized rate as of April. Since 1970, the economy has never avoided a recession when real retail sales sustainably contracted according to EPB Macro Research. Real Retail Sales are usually falling at an annualized rate of 1% or greater when recessions begin. See nearby chart. Today, real retail sales are contracting at twice that rate. That fact does not support a narrative that consumer spending is keeping the economy out of recession.


Visible Inflation
If temperatures below the surface of the economy are cooling, in some cases rapidly, where is the evidence in the inflation figures? While headline inflation figures have leveled out after several months of marked decline, there continue to be signs in the details which point to lower inflation in the relatively near future. According to EPB Macro Research, the shelter component of CPI, which has a roughly ten-month lag, is currently boosting CPI by ~200bps, and is “causing the Federal Reserve to hold policy far tighter than the underlying economy can handle.” EPB has calculated that the “much-feared service sector inflation has also cooled sharply in recent months. The 3-month annualized pace of services inflation less rent has fallen to 0.8%, while the 6-month pace has dropped to 3.7%.” See nearby chart.
Conclusion
So, what does the Fed do? We think current market pricing for the forward SOFR curve, ~30% chance of 25bps June hike and ~45% chance of July hike, are pretty close to correct, leaving a 50%+ chance that the Fed is already done raising rates. Although our reasoning is less discussed than the discourse in the mainstream economic commentary. Last quarter we suggested focusing on the Employment Cost Index (ECI) and employment costs more broadly. Well, the ECI has turned down on a year-over-year basis, but barely, and actually ticked up slightly on an annualized 1Q23 basis. See nearby chart. Hourly earnings are slowing more rapidly. If the trend continues without a stall, then the Fed is likely done, if not, there could be another 25bps lurking in the future. Our bet is they are done.
Addendum
Last quarter we promised a quick look at the impacts of de-globalization and reshoring on U.S. inflation. Wells Fargo released some excellent analysis on this subject back in early March 2023. You can access a copy of the Wells Fargo report here. In it, the team outlines the clear trend of moderating goods prices over the period from 1996 to 2019, during which imports soared as a percent of GDP and prices of core goods (goods excl. food and energy) rose only 0.2% per annum on average as compared to 2.7% per annum from 1985 to 1995.

