In this report we touch upon various elements of CRE market conditions including a few bright spots that support our thesis on building new industrial projects across our target markets, as well as highlight some positive elements of those target markets and their continued growth from pre-Covid to today. We will also provide our updated assessment of macro-economic conditions regarding how confusion about economic direction seems to be on the rise.
The Table of Contents below can assist with navigating to a preferred section or getting a quick general take.
- Fund Updates: High level news on Fund activity..
- Real Estate Market Conditions: In this section, we will review:
- Industrial supply revisited, ZIRP inspired deliveries.
- 2025 Industrial Supply Scarcity leads to opportunity.
- Lone Star Mtn. West, Southwest, Sunbelt - “can’t touch this…”
- Macro Economic Conditions:
- “Over Under Sideways Down” – A plethora of mixed signals
Fund Updates
Fund III:
We are happy to report that Scarlet Oak, in Charlotte, NC, part of “The Oaks” and a member of the Airport 3 portfolio, sold in early February 2024. This single-story flex industrial asset is a well-timed realization and a testament to our Asset Management and Property Management TEAM’s execution of the business plan resulting in a profitable disposition. Scarlett Oak produced an average cash-on-cash return over the investment period of approximately 13%. Based on the Fund III allocated purchase price, Scarlet Oak outperformed our underwritten returns. The succesSFul business plan included rebranding the property towards industrial, marking-to-market existing tenants and leasing the remaining vacancy. The realized internal rate of return for this investment totaled 22.3% assuming the existing debt payoff assumptions. Further, as part of this sale, we reduced our outstanding loan balance on the two remaining properties (Airport Overlook and 9101 Southern Pine, now aka: “Airport 2”) to $8.3 million or $66.53 pSF. We are currently in discussions with our existing lender on the “Airport 2” assets to extend that loan as part of this paydown amount with Scarlet Oak sale.Please refer to the Manager’s Letter later in this report for additional specifics on the assets in Fund III.
Fund IV:
As mentioned last quarter, the sale process for the “The Oaks” is continuing, providing one full realization for Fund IV, English Oak. English Oak sold for over $9 million and produced an average cash-on-cash return over the investment period of approximately 5%. The gross sale price was just under two times the Fund IV allocated acquisition purchase, resulting in a nice round trip for this asset specific execution. On a property level basis, the sale of English Oak outperformed our underwritten returns, as we succesSFully completed our business plan via rebranding the property, marking-to-market existing tenants with in-place rents of $12.38 pSF net at acquisition and through our Asset and Property Management TEAMs we increased rents to over $15.00 pSF net at sale, as well as leasing all the remaining vacancies.Fund IV’s recently delivered Port 45 industrial project in Dallas, TX has seen an uptick in interest from prospective tenants, and we hope to announce a few new leases for the asset in next quarter’s report. Prospect interest in the Saturn Crossing industrial project in Spring Hill, TN remains solid, and we are finalizing lease documents for the first tenant.
Please refer to the Manager’s Letter later in this report for additional specifics on the assets in Fund IV.
Real Estate Market Conditions
The following are brief observations on current commercial real estate (“CRE”) market conditions with our latest Griffin Partners Brief Takes:
Industrial supply revisited, ZIRP inspired deliveries:
- Looking at the amount of new industrial supply that was delivered in the back half of 2023 and what is coming in 2024 one can observe the latest and last wave of “Zero Interest Rate Policy” (ZIRP) supply. This mountain of supply won’t likely be repeated for years to come, at least not over the next five plus years in our opinion. The “ZIRP” inspired industrial delivery wave, coined by Dane Bowler from Seeking Alpha in his early 2024 Real Estate Supply Report, “…. essentially destroyed “barriers to entry” as capital became nearly free, such that having to wait two to three years to see a return no longer became a problem. For example, a developer had the ability to take opportunistic development risk in gateway markets for as little as 4.5%.”
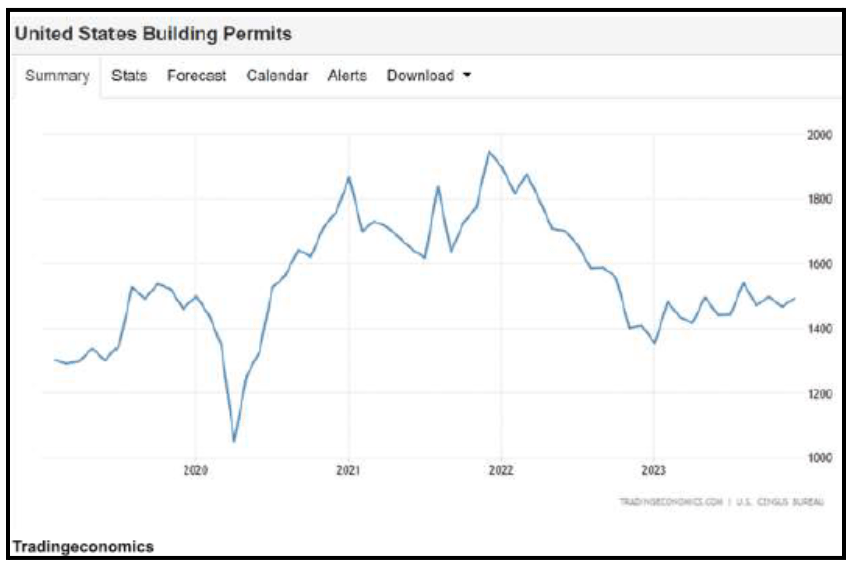 That simply wasn’t going to last but with rates as low as they were the supply just kept coming. You can see in the table nearby, US building permits almost peaked in 2021, but no, the flames got even hotter on supply and finally peaked as of YE2022 with rates at nearly zero or ZIRP! As Dane Bowler also mentioned in his article, 2024 is “going to be a particularly interesting year for new supply” and going forward in the early days of 2024 and into 2025 we will transition from an “era of perpetual full or oversupply into a new era of scarcity.”
- Looking at the amount of new industrial supply that was delivered in the back half of 2023 and what is coming in 2024 one can observe the latest and last wave of “Zero Interest Rate Policy” (ZIRP) supply. This mountain of supply won’t likely be repeated for years to come, at least not over the next five plus years in our opinion. The “ZIRP” inspired industrial delivery wave, coined by Dane Bowler from Seeking Alpha in his early 2024 Real Estate Supply Report, “…. essentially destroyed “barriers to entry” as capital became nearly free, such that having to wait two to three years to see a return no longer became a problem. For example, a developer had the ability to take opportunistic development risk in gateway markets for as little as 4.5%.”
2025 Industrial Supply Scarcity leads to opportunity:
- As capital has begun to have a real cost, we will continue to see industrial development fall dramatically as well as in other CRE sectors. We will see oversupply in various parts of the industrial property types, especially those assets greater than 300,000 square feet (SF). The wave of new industrial supply will eventually be absorbed and provide a new opportunity for development to push back into the market.
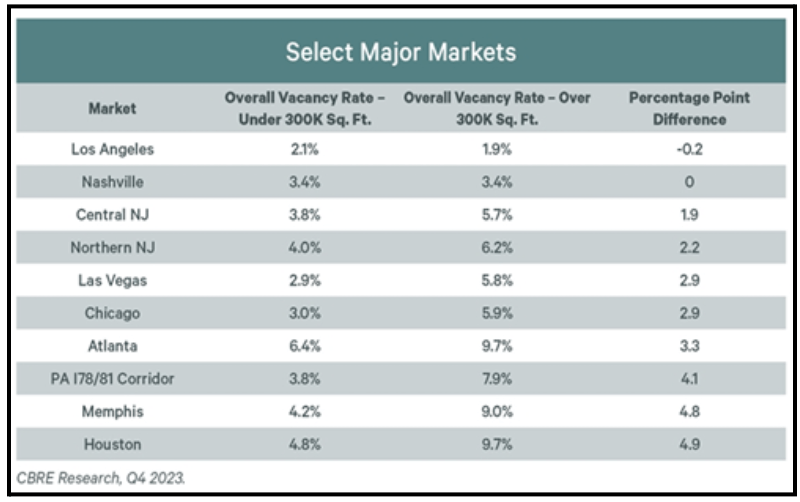
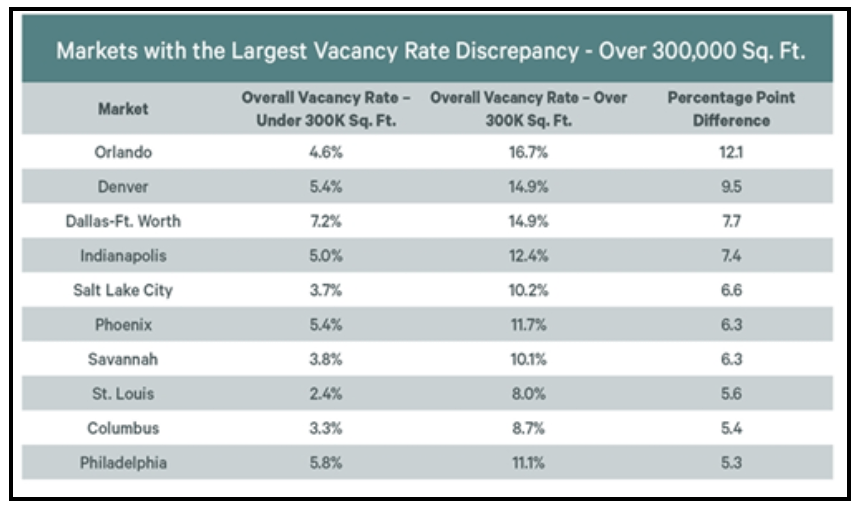
We believe our strategy of finding strong in-fill locations catering to surrounding zip codes as well as direct access to major interstates will provide significant opportunities over the next 24 months. Cities such as Houston, Dallas, Raleigh/Durham/Greensboro area, as well as Nashville and Charlotte should continue to see low vacancies in the smaller product. The nearby graphic, provided by CBRE Research for 4Q-2023, summarizes select major markets across the US that have some of the lowest vacancy rates under 300,000 SF as well as the largest percentage point difference between assets over 300K SF and those below this threshold. Houston is #1 on the list with a delta of just under 5.0% on vacancies below or above 300K SF (4.8% vacancy rate below 300,000 SF vs. 9.7% vacancy above 300K SF threshold)
- As capital has begun to have a real cost, we will continue to see industrial development fall dramatically as well as in other CRE sectors. We will see oversupply in various parts of the industrial property types, especially those assets greater than 300,000 square feet (SF). The wave of new industrial supply will eventually be absorbed and provide a new opportunity for development to push back into the market.
- The back half of 2024 should see dwindling deliveries according to CoStar “…as more than 80% of unleased industrial projects broke ground before August 2023, when the SOFR (Secured Overnight Financing Rate) reached its 2023 peak of 5.3%, where it has remained since.” With the average development time for large industrial projects of 14 months, this implies that that more than 75% of the new supply will be delivered in the next 9 months. As readers can see in the nearby graphic from CoStar, U.S. Industrial vacancies are projected to peak in mid-2024 with this last wave of ZIRP supply.
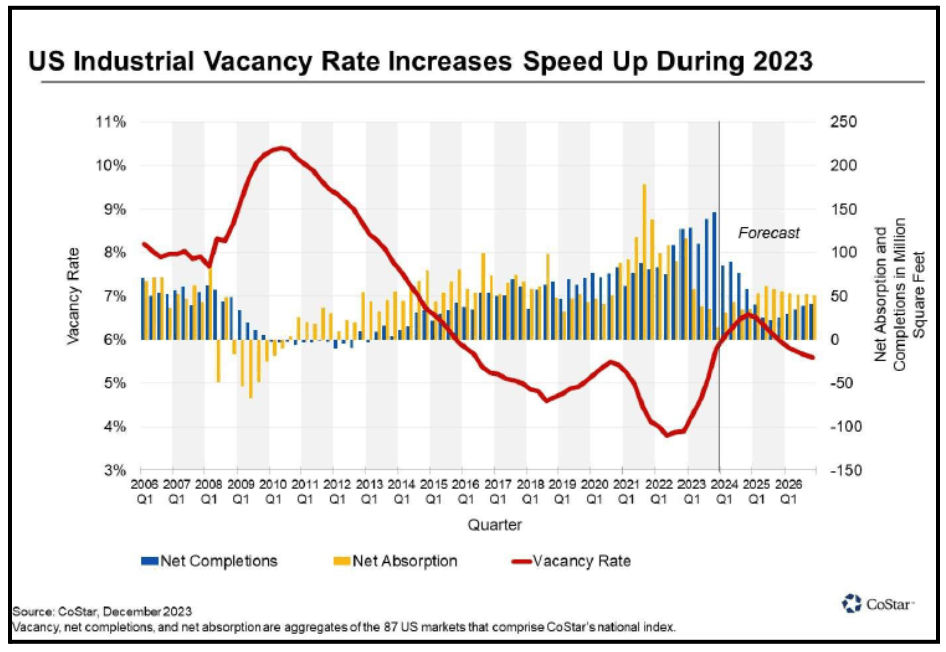 Going forward into 2025 CoStar projects limited or a normalized delivery pipeline within the Industrial sector. Further, per the January 2024 CBRE report from James Breeze, VP of Global Head of Industrial Research, vacancy will “peak at around 5.4% at mid-year (2024) before beginning to decline the second half of the year into 2025.”Scarcity is likely to occur in 2025 and will position our Nashville project (Earhart Industrial Park, a two building 2.2M+ SF project) as the only partner at the dance with zero other options for tenants to select from for large requirements. New construction has virtually shut down for industrial assets greater than 500,000 SF in all of middle Tennessee. Our Earhart project is an anomaly for us because of its large size, but due to our deep understanding of the east side of Nashville, including the Park 109 (375,000 SF) project, we have strong conviction on delivering this “big box” product within this submarket.
 As we continue to develop our pipeline most, if not all, of our new projects will be targeted towards buildings that range in size from ~40,000 SF to as large as ~250,000 SF. For example, within our current pipeline across four different land tracts in three different metros (yet to be awarded), we are designing industrial assets ranging in size from 40,000 SF to 200,000 SF. with various forms of rear-load, front-load and cross dock configuration catering to these “smaller” tenants.
The Lone Star, Mtn. West, Southwest, Sunbelt - “can’t touch this…”
- Impressive, continued growth by Texas markets and our other target areas, that’s the takeaway if you want to stop reading now. The State of Texas never ceases to amaze us as well as the resilience of the US economic and demographic engine. Per Apricitas Economics, Joseph Politano, “…nearly four years since the start of COVID,
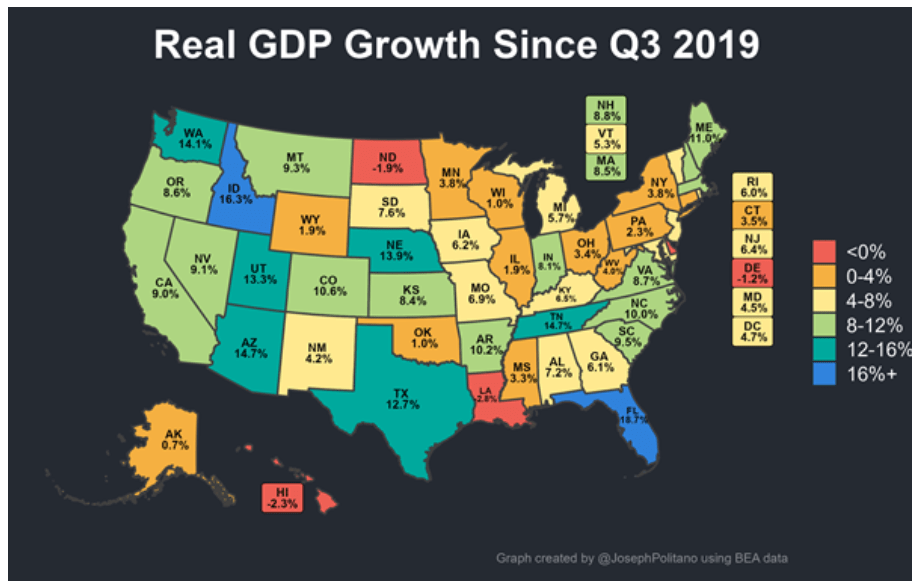 almost every single state has now seen its economic output finally exceed pre-pandemic levels-and few stragglers, mostly small states dominated by struggling local industries.” The nearby map confirms what we have witnessed across most of our ten target markets - continued GDP growth from Q3-2019 to YE-2023. This map summarizing GDP growth bodes well as we continue to look for opportunities in areas to buy and build a durable and sustainable portfolio with our remaining Fund IV capital. For example, moving west to east, UT, AZ, CO, TX, TN, NC all have shown double digit Real GDP Growth of 13.3%, 14.7%, 10.6%, 12.7%, 14.7%, and 10.0% respectively, wow!
A few other key takeaways about the markets we cover, quoted directly from Apricitas Economics, highlight what we’ve witnessed in the last four years:
- “Texas’ growth has been among the most impressive given its size; its real economic output has increased by $230B over the last four years, putting it just barely behind California as the second-largest contributor to nationwide growth despite Texas’ economy ending 2019 30% smaller than California’s.”
- “…The largest shift (GDP growth) is the widespread boom across the American South, including Tennessee, Arkansas, North and South Carolina, Florida, and of course Texas as long-term southward domestic migration patterns got supercharged by remote work and a construction boom has engrossed most of the sunbelt.”
- “…Most impressive has been the 8.7% growth in Florida and 8.8% growth in Texas, making the two states far and away the largest contributors to overall nationwide job gains.”

- “Job growth in Florida and Texas has been so large that one in three new jobs in America come from those two states, and more than one in five come from Texas alone. This was in large part thanks to a white-collar boom —In the Lone Star state, more than 300k new jobs came from professional & business services and another 100k came from financial services, with the equivalent figures standing at nearly 250k and 85k in the Sunshine state.”
- “Texas’s boom is perhaps most emblematic of the shifts since the pandemic—growth has been large but heavily concentrated between Austin, Dallas, and Houston, and within this triangle, it’s the principal counties of these three metro areas that have grown the most. Remote work has thus dramatically shifted GDP between regions to the benefit of states like Texas and has enabled substantial migration out of cities in search of more affordable housing arrangements, but it has not changed the fact that suburbs remain well in the economic orbit of their principal cities.”
- And last bullet, I promise, “…. much of the changes in economic geography brought about by the pandemic reflect shifts in growth dynamics between metro areas, not within them. And those changes have been substantial, for example, the Dallas metro area, despite being less than 1/3 the size of the New York metro, has contributed more to nationwide economic growth over the last three years than any other.”
In short, all the above plays directly into our thesis of building and buying in suburban-urban areas and key transportation corridors across the great state of Texas, as well as the Mountain West (CO and UT), Southwest (AZ) and the Sunbelt (TN and NC).
Macro-Economic Conditions
(Hey!) Over, under, sideways, down(Hey!) Backwards, forwards, square, and round
When will it end? (When will it end?)
When will it end? (When will it end?)
The Yardbirds (Beck version), 1966
As we go to press (a few days late this quarter), there are mixed economic signals everywhere. Our more frequent readers know we have been expecting a cooling off for a few quarters now; however, convincing evidence of such a slowdown remains somewhat elusive. There are certainly some signs in the data that support the cooling narrative, but there are also signs of acceleration, as well as neutral data points. With apologies for the brevity and overuse of graphics this quarter, here is the tale of the tape:
OVER
GDP growth, while down slightly in Q4-2023 compared to Q3, is still above long-term trend for both Q4 and the full year 2023. Moody’s reports that “real GDP declined from a clearly unsustainable 4.9% in the third quarter to a still unlikely to be sustained 3.2% in the fourth quarter….” 2023 GDP growth was higher than 2022, and U.S. growth is outperforming the other G7 countries.

Part of the improving inflation picture can be explained by meaningful gains in productivity. Some pundits speculate the further gains in productivity are on the horizon as Artificial Intelligence rides to our rescue!

UNDER


SIDEWAYS


Conclusion – Interest Rates
We believe that the highest real interest rates since before the GFC 17 years ago and the deceleration of historic and unsustainable fiscal stimulus will ultimately lead to a recession in the U.S. However, we have developed less conviction about when that will happen. We also believe that the Fed will be reluctant to surrender hard won gains in the effort to normalize interest rates. As such, we are unlikely to see a return to negative real interest rates during the next recession. Absent a severe recession, we foresee a short end of the rate curve settling between 2.5% and 3%, and long rates about where they are now. It is possible that long rates could rise if the U.S. does not achieve any meaningful improvement on its long run fiscal situation. If that were to occur, we would need to add the 4th word from the Yardbirds’ song title to our narrative. DOWN!