See the Table of Contents below to assist with navigating to a preferred section or getting a quick take.
- Fund Updates: High level news on Fund activity.
- Real Estate Market Conditions: In this section, we will examine:
- A few “GP Brief-Takes” including a summary of why the debt market slowed to a crawl in the second half of 2022, how that restrictive debt market reduced overall pricing as indexes declined possibly approaching a bottom and cap rates expanded, and lastly how less attractive debt and rising cap rates forced investor strategies to shift.
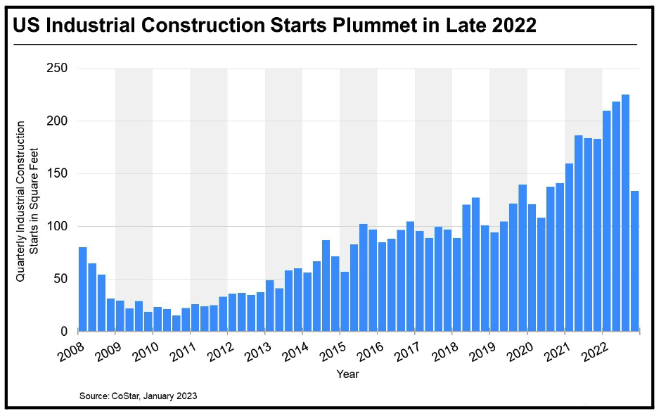
- In the second half of this year-end report we will focus on the resilience of the industrial sector and the demand tailwinds within the sector, particularly in our target markets, and the implication slowed construction starts may have on future supply across the Industrial sector.
- Macro Economic Conditions: This section includes out thoughts on:
- After several months of declining inflation, is inflation heating back up as the January data would indicate? Hot job creation and retail sales data seem to indicate a reversal of progress against inflation, but we think the preponderance of evidence leans the other way.
- What would the inflation figures look like if shelter costs reflected the real time declines in rents seen since 2Q-2022?
Fund Updates
Fund III: All of Fund III’s ten remaining assets are office buildings. Two of the ten are mixed use, office over retail and have no retail vacancies. The impact of work-from-home (WFH) is a headwind for almost all office assets. All the Fund’s industrial investments have been successfully realized. Some of the Fund’s remaining investments have exposure to rising interest rates which have negatively impacted cash flow. Two assets have near term loan maturities, and new loan terms have been agreed to with the lenders as of the publishing date of this report. Our team has been successful in moving the loans on two assets from a floating rate to a locked interest rate at 6%. These two 6% locked rates significantly improve the interest rate risk profile of Fund III’s remaining portfolio.
Fund IV: Closed! Griffin Partners Value & Income Fund IV (“Fund IV”) has concluded its fund-raising period as of YE 2022. We are grateful for all those that participated in the latest Fund offering.
Real Estate Market Conditions
The following are a few recent observations on current commercial real estate (“CRE”) market conditions coupled with a few pages of written material. First, a few “GP Brief Takes”:
GP brief takes:
- Lending Market ~ “The River Runs Dry”: A recently published article from our friends at CrowdStreet (CS) with this tagline above, Ian Formigle, CIO of CS, provided three key factors we completely agree with that have adversely affected the current lending market:
- Higher Rates: The Secured Overnight Financing Rate (“SOFR”), the benchmark that most CRE investors use to price loans for asset transactions shot up from essentially 0% at beginning of 2022 to 4.5%+/- as of YE 2022. Effectively, borrowing costs were quicky outsized (too expensive) and negative leverage occurred, hence the markets froze in 2H2022.
- Higher Lending Spreads: For the first time in our years of observation over several real estate cycles, we are seeing lending spreads widen or expand while interest rates rise rapidly. In the early stages of previous cycles an increase in the index rates (LIBOR) led lender spreads to tighten as lender risk appetites were still “ON”. In this case when rates skyrocketed, lenders attitude towards risk turned “OFF”, and in turn lender spreads widened quickly.
- Increased reserve requirements for Banks: Ian Formigle in his year-end 2022 discussion to investors “…The Fed increased reserve requirements for the banking sector in Q3-2022 as a means to remove lending liquidity from the market.” Due to this forced requirement “we witnessed the major money center banks (e.g. JP Morgan Chase, Citi, Wells Fargo and Bank of America) move to the sidelines, taking a massive share of the CRE lending market out of the game.” This Fed action slowed lending to crawl in the 2H-2022.
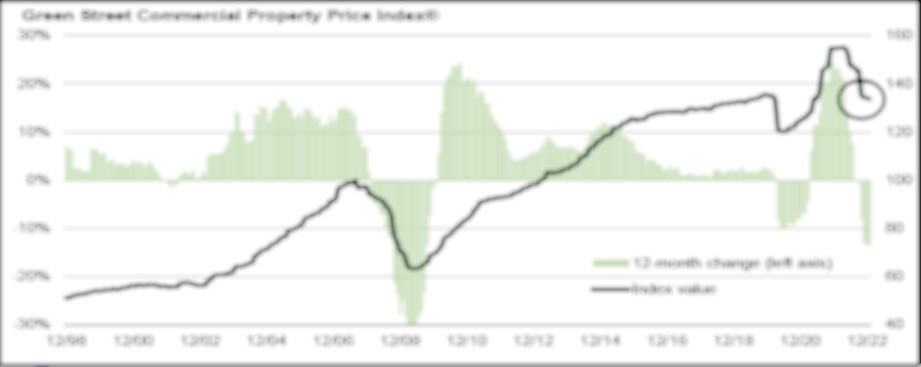
- Pricing Reset & Capital Flows: As investors witnessed debt costs skyrocket via SOFR, along with the Fed historic push on interest rates, overall asset value pricing decreased quickly in 2H-2022. Banks retreated by widening spreads or simply not fielding loan requests. All-in rates borrowing moved from around 4% to as much as 8%. The eventual trading slack finally bled into the market, and transaction volume slowed to a standstill with activity plunging in 4Q-2022. Like last quarter, we provide below GreenSteet’s most recent Commercial Property Index (CPPI). Property prices across all major CRE sectors were down 14% from their peak in March 2022. As you can see from the CPPI graph (circle) there may be a trough in pricing across the various sectors. This could be an early sign that pricing is bottoming out. As in most down cycles, investors with deep pockets start to purchase assets on an unlevered basis. This is occurring today and is an early sign of a potential bottoming of the Index.
Click here to request the full Q4 2022 Report.
- Shifting Investor Strategy: Per Damian Harrington, Head of Global Capital Market Research at Colliers, the “full outcome [pricing declines] for the market could take up to 24 months to fully materialize, but the next six months will be driven by a re-calibration of pricing”. As we touched upon in our second “GP brief take” the CPPI has made a quick retreat although pricing declines will differ per Mr. Harrington “…. dependent upon local real estate fundamentals and the pricing dynamics in a particular market”.
As capital flows open back up, investor strategies will shift. For example, one of our existing institutional partners stated in early December 2022, “…. we are out of the equity game; we are solely focused on debt for the time being”. The simple reason investor strategies will or have swung in the short run is because well capitalized groups can provide a higher risk adjusted return to their investors via the debt side of the capital stack rather than equity. For example, providing second lien financing at high teen coupons and a compelling basis, coupled with a security interest in the equity makes a lot more sense than an equity return with a much larger degree of risk when values are still in flux. As capital flow shifts, it will create an opportunity for our latest Fund IV investment period. Colliers Global Capital Markets Director, Chris Pilgrim stated “…Now is a time of opportunity. If investors pick their markets, assets and strategies carefully, this a good time to capitalize.”
Industrial Sector - “The Defending Champ”
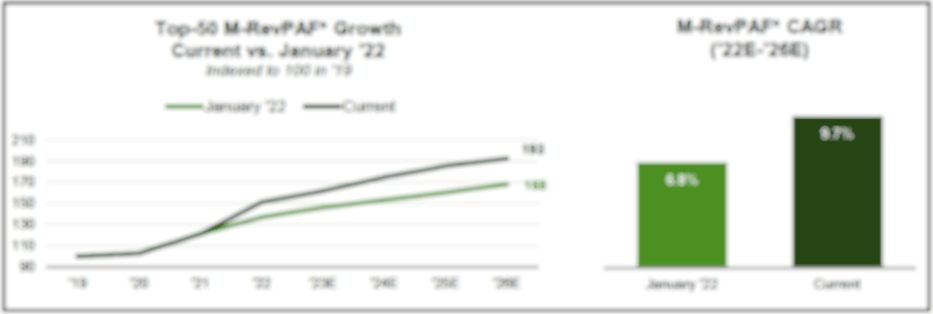
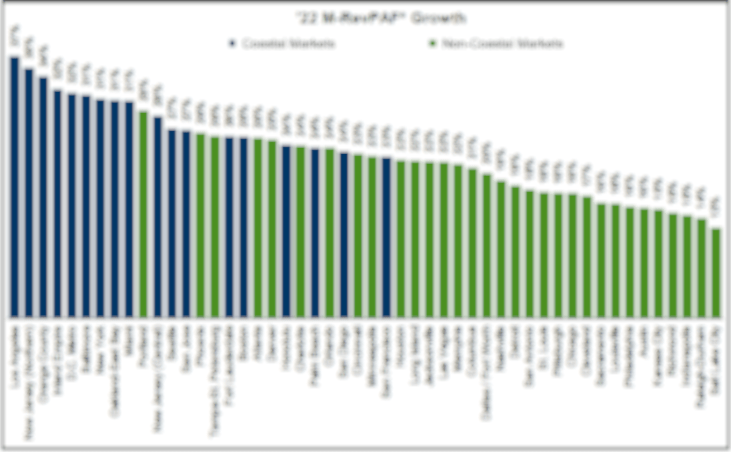
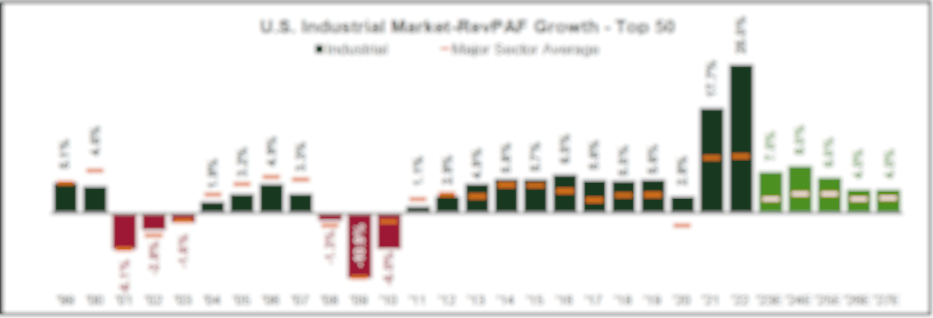
From our last quarterly report: “…Industrial metrics are incredibly positive, and we believe that positive momentum will continue in the near-term as the development slowdown continues and supply tightens.” As the COO of Blackstone, Jon Gray, put it: “in an environment like this, you start to see a reduction in new supply, which is obviously helpful in the long term; and these hard assets are beneficial because they don't have much exposure to input costs, [then] there's going to be fewer [real assets] built”. Those previous comments remain true today. GreenStreet’s US most recent Industrial Outlook report for 2023 forecasts fundamentals to continue to “…surprise throughout 2022, even after a record year in ’21. Industrial M-RevPAF growth reach a record 25% in ‘22, blowing through ’21 high watermark of 18%.” M-RevPAF stands for Market Revenue per Available (square) Foot and is a measure of the health of a market which combines effective market rent and occupancy into a single value.
The graphic below depicts the Top-50 M-RevPAF Growth industrial markets from January 22 to today, the new projections are flying past previous 12 months projected growth, a strong sign of continued demand fundamentals within the Industrial Sector.
Click here to request the full Q4 2022 Report.
Click here to request the full Q4 2022 Report.
As the bar chart details, even with anticipated slowdown in H1-2023, GreenStreet forecasts demand growth to continue for several more years, averaging 6%+/- growth across the Top-50 markets through 2027. This projected growth is similar to the durable industrial demand experienced prior to Covid beginning in 2014-2015 (see bar chart above).
Click here to request the full Q4 2022 Report.
Click here to request the full Q4 2022 Report.
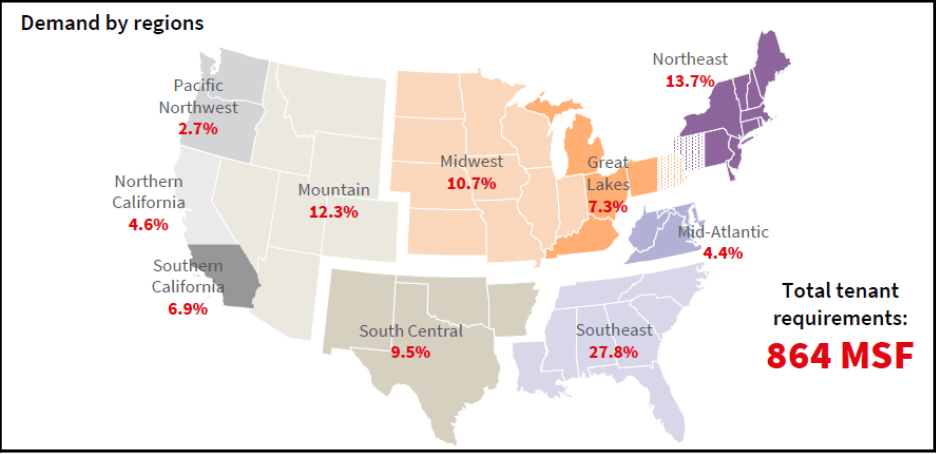
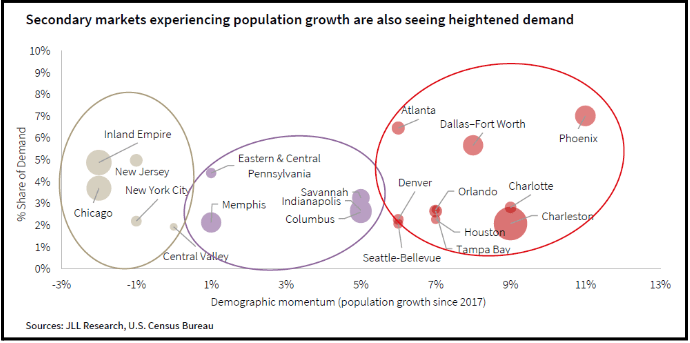
As the above US map from JLL depicts, the Southeast is the clear winner for highest percentage of requirements across the nation. Furthermore, the JLL report mentions strong population migration which continues to shift demand to areas with robust demand for housing. On that note, this same report produced a graphic plotting the % share of Demand versus Demographic momentum gains (population growth since ’17) and the results indicate (no surprise to us) secondary markets continue to flourish (see below).
As the nearby graphic above depicts, cities such as Houston, Denver, Charlotte, and Dallas show “Demographic momentum” as well as “% share of Demand” in the high single digits in terms of growth, blowing past the primary markets such as Inland Empire, Chicago and the upper East Coast.
Click here to request the full Q4 2022 Report.
Lastly, US industrial leasing demand totaled roughly 275 million square feet as of 4Q-2022 per CoStar, “…a decline of just 8% from the strongest fourth quarter leasing tally ever recorded one year earlier in 2021”.
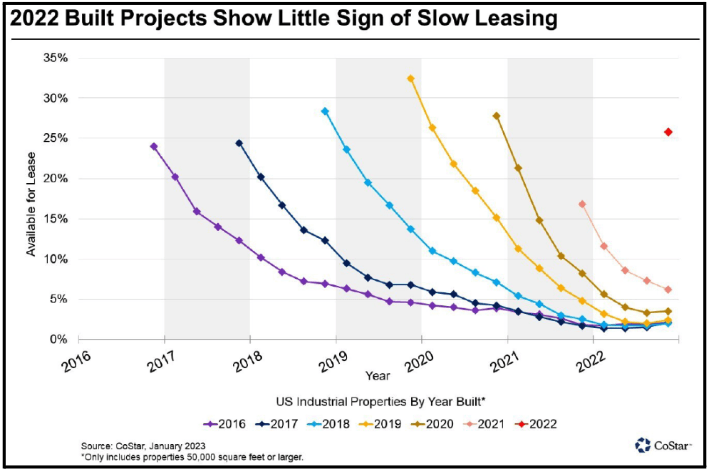
What we are seeing on the ground regarding the pullback of industrial construction starts is related more to the increasing cost of construction labor, materials, and most importantly, financing. The YE 2022 graphic (nearby final chart) from CoStar details the continued leasing demand each year since 2017 through YE 2022. As the graph highlights, only 26% (red dot on far-right side) of the space located in large industrial properties that completed construction in 2022 is still available for lease. This high level of percent leased today for 2022 vintage product is an indication of the likely continued demand for product delivering in the near future. Those developers delivering the right product should benefit from this continued demand.
Macro-Economic Conditions
Inflation – Course Change or Statistical Noise?
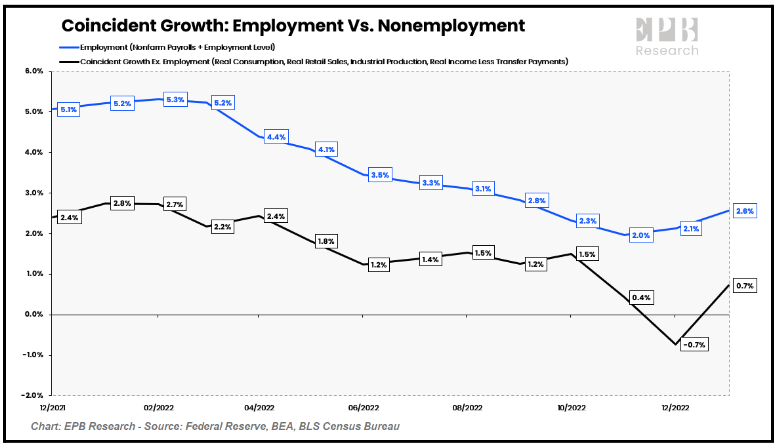
Leading Economic Indicators (LEI) have been receding for almost a year. Coincident economic data had been consistently pointing to slower growth since peaking in February 2022……….until January. The blowout January jobs report and the meaningful rise in retail sales, both coincident indicators, call into question whether the path of growth and inflation pressure will continue to decline. Both were of a sufficient order of magnitude to at least raise the question of whether we are at an inflection point. See the nearby chart of Coincident Indicators. Some economists have even gone so far as to say we are making a soft landing. Interest rate markets have priced-in higher rates for a longer period. Most believe the Fed now has more room to further raise short term rates. Importantly, leading indicators have not confirmed any change in direction, continuing to decline month over month in January and down 3.6% over the six-month period between July 2022 and January 2023, which is an even steeper rate of decline than the LEI’s 2.4% drop over the previous six-month period ending in July 2022.
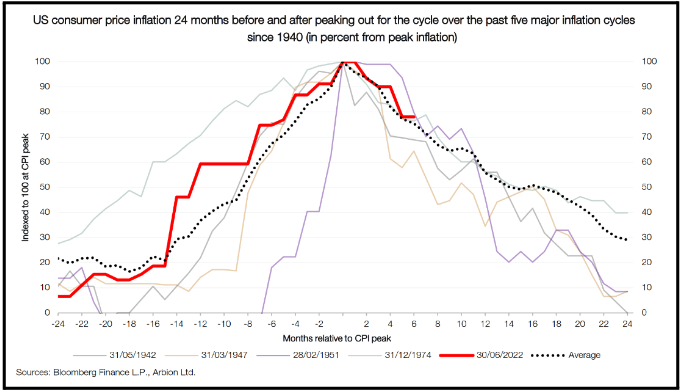
Past inflationary periods have followed reasonably consistent patterns leading up to and following the point of peak inflation. The chart above shows this pattern clearly, and it also indicates that the current trajectory of inflation (red line) is highly consistent with the historical average (dotted black line) including the period starting in the 1970’s which ended in the 1980’s. At least so far.
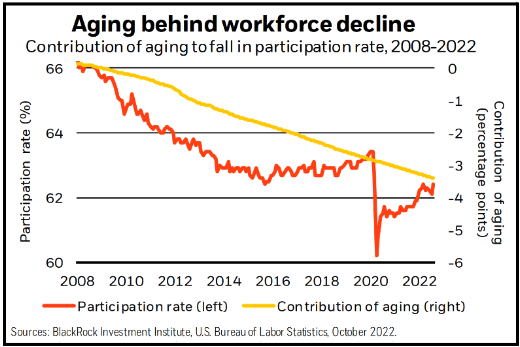
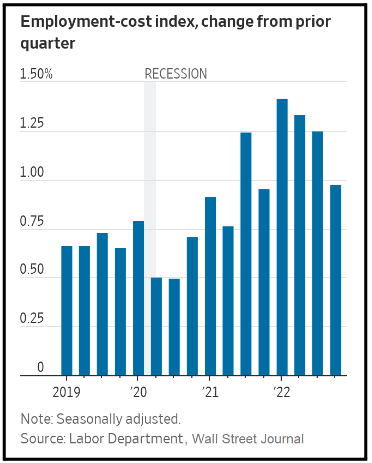
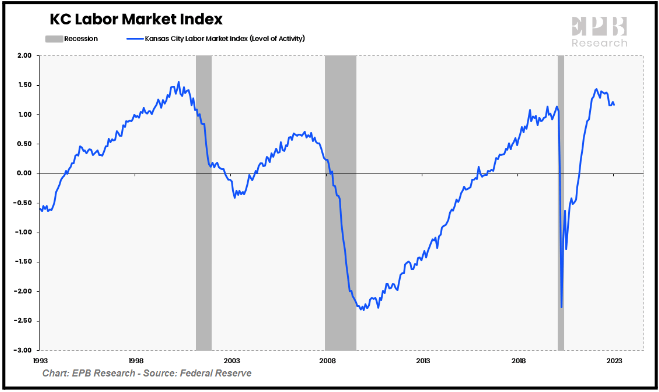
What could keep inflation on a trajectory above the average cycle line? Structural changes in the labor force or a resurgence in energy prices. Our readers know we have long promoted the idea that most bouts of inflation over the past century (the Age of Oil) have been linked to spikes in oil prices. So, we won’t go down that rabbit hole again. What about structural changes in the labor force?
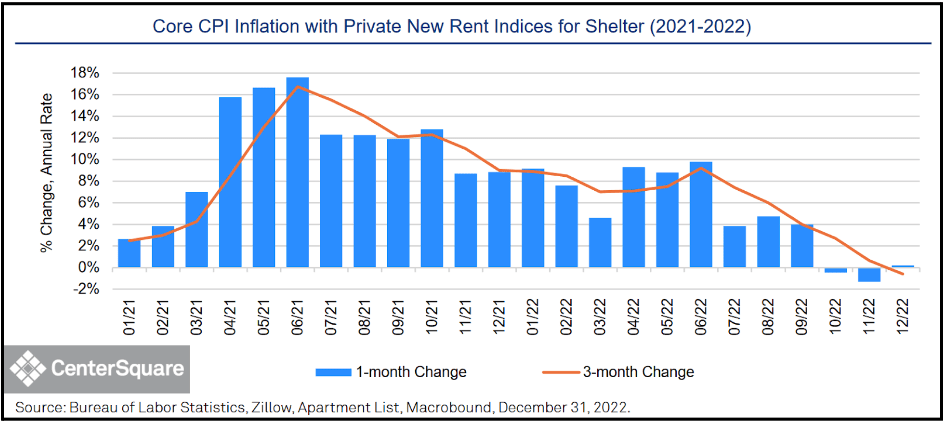
the conditions in the market roughly ten months ago which are just now impacting the CPI and PCE, are significant enough to call attention to. According to Eastdil, rents bottomed in June 2020, and the housing services component of the PCE index did not bottom until March 2021, ten months later. Shelter costs comprise 32.4% of CPI. U.S. national apartment rents peaked sometime around April 2022, meaning the peak of shelter costs in the inflation indices should be approximately February 2023. One of our long-standing institutional partners, Center Square, constructed a very interesting chart combining Core CPI with the current rent indices for shelter, thus eliminating the approximately ten-month lag in shelter costs found in the government indices. Low-and-behold, overall inflation in December 2022 using that methodology was effectively ZERO!
Conclusion
We are moderately confident inflation will continue to decelerate, returning to the 3% range in 3Q-2023. The Fed will likely get to the higher terminal rate now priced into the market, approximately 5.25%, but may not stay there are long as the market currently anticipates.
Next quarter we will look at longer term secular issues impacting inflation, namely de-globalization, which according to some analysts has actually been underway since 2008, and the potential de-dollarization, which if achieved by China and others wishing to see it, could be a very large problem for the U.S..
