
As we go to publication, the war in Central Europe has begun. We sympathize with all people facing the atrocities of war wherever they may be. Sadly, it appears the world may now be moving back towards a period of resolving geopolitical problems primarily with force, which certainly will have implications well beyond what we may be able to foresee at present.
Year-end 2021 was a sprint to the finish, which ultimately topped pre-COVID volume and pricing records for both the industrial and multi-family sectors. In our comments below, we will touch upon both sectors and provide more detailed insights on industrial, considering our continued appetite for developing this product type.
The Table of Contents below will hopefully assist our readers with navigating to a preferred section or getting a quick general take.
● REAL ESTATE MARKET CONDITIONS: In this section, we provide a brief review of the following: o “Brief-Takes” observed over the last 90 days, including: 1. Rising friction with local municipality approvals of new speculative industrial projects and the resulting effects on supply and costs, and 2. The pitfalls of the third-party appraisals on existing assets and new industrial construction financings. o Summary of continued high transaction volumes and pricing across both industrial and multi-family sectors in 2021. Further, we will touch upon the limited new industrial supply across the US, resulting in continued rent growth coupled with the demand drivers transforming various secondary markets into major logistics hubs.
● MACRO-ECONOMIC CONDITIONS: In this section, we will assess inflation, signals from the financial markets about the likely trajectory of rate hikes (not as radical as some think), our prediction of peak interest rates (take it to Vegas), and the deceleration of growth.
REAL ESTATE MARKET CONDITIONS
Here are a few recent observations we have made on current commercial real estate (CRE) conditions followed by a few pages of discussion on industrial fundamentals. GP brief takes:
- Local Municipalities Industrial New Construction Approvals: The process that our TEAM, as well as our competitors, are working through with local municipalities to entitle and build new speculative industrial projects is becoming increasingly difficult. Secondary cities such as Charlotte, Columbus, Nashville, Orlando, and Phoenix (to name a few) are being transformed, and the local municipalities and counties in these markets have become increasingly resistant to approving new industrial development. For example, within the Nashville MSA, the surrounding counties and smaller municipalities comprising the industrial suburban submarkets have relatively small county and/or city councils that are overwhelmed with applications for approval to build new industrial projects. In some cases, the eastern and southern Nashville municipalities have witnessed a ten-fold increase in applications for new industrial site plan approvals or rezoning requests. It has become difficult for these small cities to handle the growth, which has led to employee turnover in these planning departments, further delaying the process for developers to receive approvals. This is both good and bad. The good news, these processes have slowed new supply coming online. The bad, the situation has forced developers to absorb escalating project costs resulting from the requirements these municipalities are compelling developers to include. The increasing requirements are reducing projects’ yield on cost, and the only release valve is to push for higher rents to offset the added cost. These previously quiet rural areas along major trade routes (in this case, I-40 or I-24 in Nashville, TN) are just one of the many examples of other major secondary markets that are witnessing strong demand with limited new supply, supporting our near-term view that rents will continue to increase over the next three to four years.
- 3rd party appraisals ripple effect on transactions: Most, if not all, speculative industrial development that is securing bank construction financing is required to have a third-party appraisal completed for the respective lender’s credit approval. For that matter, any commercial real estate asset that is securing bank financing will be required to have a third-party appraisal. US banks are hindered from selecting a specific appraiser and are required to have a blind pool of at least three appraisal bids, and the borrower is required to select blindly the appraisal company #A, #B, or #C based solely on delivery time in 3 to 4 weeks and a cost that ranges from$4,000 to $9,000. A problem is arising because appraisal groups are overwhelmed with the high volume of requests, and in many cases, their data is outdated regarding sales comps with outdated cap rate information for newly developed projects, as well as rental comps that are 3 to 6 months old in markets with rapidly rising rents.
The crux of the current appraisal process difficulties involves developers / owners forecasting accelerating trends regarding rent growth and future supply / demand dynamics, while appraisers are frequently using data which meaningfully trails those trends. The result is a gap between the opinions of appraisers and owners regarding the future stabilized values. All banks must adhere to the stabilized value benchmark to lend on a project. For example, a bank will require in its terms to have a construction loan based upon on the lesser of 60% loan-to-cost to build the project today or 60% of the future “stabilized value” with a debt yield of 9.0% (NOI /Total Loan Amount). The first loan-to-cost test is relatively easy to pass because of high construction costs today, but the second (“stabilized value”) is based on the then-future value of a project based on projected rents. So, if the appraiser only grows rents 3% over a 3 to 5 year period with data that is 6 months old, the appraised “stabilized value” has the risk of coming in below this 60% “stabilized value” threshold. If the future value comes in below this 60% loan to value test, the developer loan proceeds are cut and the project requires more equity. Lower leverage forces the developer to increase rental rate assumptions, increase recourse obligations, or solve to a lower yield. This protective measure for Banks is a good thing as it will dampen aggressive lending practices and reduce free-wheeling supply, but it also is a hindrance for developers to execute a sound business plan.
We have made every effort to underwrite our existing office assets for purchase and ground-up industrial development projects in a sensible fashion; however, this partially fractured appraisal process is one of the few items beyond Griffin Partners’ control. When the appraisal process begins, we do our best to deliver to the selected appraiser the most up to the date sales comp and rental rate information. At the end of the day, the appraiser makes the value conclusions. The take-away is to pick relationship banks that understand this process and will work with the borrower to solve any appraisal issue. This relatively small third-party appraisal cost (less than .02% of a total project cost) can either keep a project pressing forward, force owners/developers to increase their equity share, restructure their financing via recourse, or in the worst-case scenario nix an acquisition or ground-up development project.
Industrial Fundamentals
As indicated in our opening comments, 2021 was a sprint to the finish with strong price increases for both the industrial and multi-family sectors for all of 2021. As Barry Sternlicht mentioned in a live stream interview with Sam Zell on the “Walker Webcast” in the early part of 2021, “…the US economy will be on a sugar high during the back half of 2021…” Those words rang true at the end of the year.
The “sugar high” analogy is synonymous with a young child’s first taste of ice cream, who then becomes so excited and race for virtually anything. We would equate this to the industrial and multi-family pricing indexes, as the two sectors have raced to record sales volumes and pricing in 2021. We have incorporated the Real Capital Analytics Price Index Chart nearby. As CoStar reported, 4Q-2021 saw a 28.5% increase in commercial real estate transaction volume over the third quarter of 2021. This equated to a “broad measure of pricing trends across all property types and US geographic regions, to the tune of $20.8 billion for the full year – an 86.3% increase over 2020”, according to Christine Cooper, chief US economist for CoStar. Further, per CoStar, the “US composite index for CRE transactions which reflects more numerous but lower-priced property sales which typically falls into secondary and third-tier markets, advances 4.7% in 4Q21.
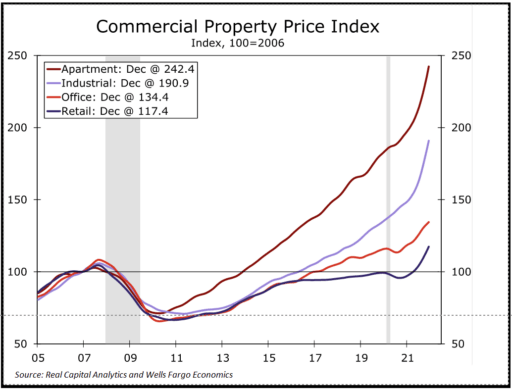
The overall index rose by 15%+ for the year and is now 22%+ above pre-pandemic levels.” Although these stats prove CRE is back in a big way, we are seeing some softening in the marketplace. For example, the “US Industrial Index advanced just 1.1% in 4Q-2021, its slowest quarterly gain in 16 quarters…..strong fundamentals have been a boon for investors in industrial but price appreciation slowed in the second half of 2021” per Christine Cooper. Although, the industrial index for the year is 26.4% above its pre-pandemic level….so clearly a sugar high indeed.
Turning the page to multi-family, pricing gains have slowed in 4Q21 but remain heated. Like the industrial index, the US Multi-family index is now 27.3% higher than its pre-pandemic levels, the fastest recovery among all six property types (industrial, office, retail, multi-family, hospitality, self-storage) per CoStar 4Q-2021. One other interesting dynamic is “investors are now shying away from the core office markets and continue to move into high-growth secondary markets in the fourth quarter”, per CoStar 4Q20211.
More relevant to areas in which we invest, secondary cities are continuing to see a tremendous amount of new industrial supply, and these markets still can’t keep up with the overall demand. According to Carolyn Salzer, Cushman & Wakefield’s head of logistics and industrial research for the Americas, “industrial is not slowing down…this sector has never had aggressive lows and, until recently, no real highs, but with the pandemic, it really exploded in 2020 with the acceleration of e-commerce, and there’s still a ton of growth yet to be had.” These are encouraging words from a leader in US industrial research. Overall demand is continuing to rise and a number of analysts per CoStar “…are pointing to the beginning of a transformation of secondary cities…into economic engines.”
Marking a new milestone in the Industrial sector, Cushman & Wakefield reported “tenants moved into 507.3 million square feet of industrial real estate in North America this year (2021), marking the first time on record demand has exceeded 500 million square feet.” Further, per CoStar2, with “…e-commerce growing and companies battling supply-chain disruptions with larger warehouse footprints, logistics companies are expanding to secondary North American cities, transforming portions of sleepier areas that have seen huge population gains in the past two years into larger distribution hubs.” For example the attached photograph gives our readers a glimpse into what is occurring on the ground in one of the fastest-growing secondary markets in the country, Nashville, TN. The photo nearby facing west along I-40 shows the newly constructed Amazon “Cube”, Industrial and Multifamily Price Surge Eases, per CoStar News, by Mark Heschmeyer (Jan 2022)
Industrial Property Demand Transforming Secondary North American Cities Into Major Logistics Hubs, per CoStar News, by Candace Carlisle (Dec 2021)
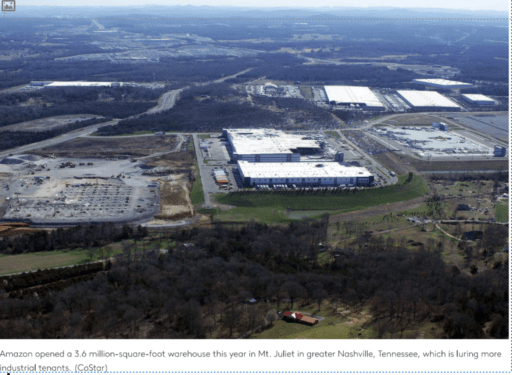
totaling 3.6 million square feet, that opened in early 2021, just west of the small town of Lebanon, TN. The “Cube” sits on the north side of I-40 west of Highway 109 and about 2 miles west of our newly developed Park 109 Industrial Park (f.k.a. Callis Road Industrial).
Industrial fundamentals remain white-hot as the U.S. is “experiencing record-low vacancy of 3.8%, with new supply expecting to remain extremely tight through 2022 through the end-2023 with vacancy inching up to 4.1%” per Carolyn Salzer with Cushman & Wakefield. The continued low vacancies will allow landlords to push rents up across the US. As we highlighted earlier, and per Cushman & Wakefield’s commentary on fundamentals: “the challenging approval process has led to a constrained supply in Canada, which Cushman found has the highest rent in North America and lowest vacancy. By the end of 2023, Canada’s overall net rent is expected to reach US$12.37 per square foot.” Further, due to the extreme supply constraints of Canada, over “94% of new industrial development will be in the US.” What does this mean for the US Industrial sector, in short, continued rent growth across the country due to supply constraints and the voracious demand for new space.
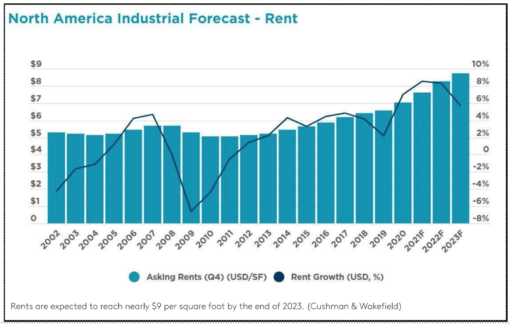
As can be seen in the graphic above, the US Industrial sector has witnessed since 2002 a slow but steady increase in rents over the last 20 years with the only exception being the Global Financial Crisis in 2009. This speaks volumes to the stability of the industrial sector and is telling that supply has failed to keep up with demand since the 2016-to-2018-time frame when rents were in the early innings of increasing across the US. The lack of new supply has created a real-time run on rental rates for the last several years. This will continue for at least three to four years before new supply can catch up to the insatiable demand for product. For example, landlords are hesitant today to execute leases longer than five years and are now preferring to execute shorter-term leases with the backdrop that rents are continuing to rise due to the growing constraints on deliveries.
As the chart depicts herein, the projected rent growth across the US is forecasted to increase 7%+ in 2022 according to Cushman & Wakefield. The forecasted rental rate growth is juxtaposed against vacancy rates that are continuing to fall or at least hold steady in the 4.0% range across the US.
MACRO-ECONOMIC CONDITIONS
“Three hikes, five hikes, eight hikes a dollar…..” While the posture of the Federal Reserve has clearly moved away from accommodative towards tightening, there remains great debate around how much the Fed will raise short term interest rates, to what degree the Fed’s balance sheet will be reduced (referred to as “Quantitative Tightening” or QT), and what will be the implementation timeline for both policy tools. There is virtual certainty that the Fed will begin the short-term rate increases at its upcoming meeting in March, and the market has already moved rates in the middle of the curve (2 to 5 year maturities) up considerably from where they were in the spring of 2021. Interestingly, the curve has flattened considerably over that period because longer term rates (10 to 30 year maturities) have not moved up as much as the middle of the curve. And, in a flight to safety, all rates have moved down since the beginning of kinetic hostilities in Ukraine.
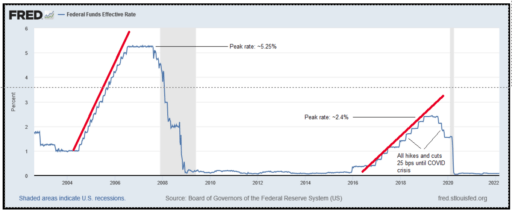
Unpacking those questions and overlaying our views a bit, we note that the Fed has developed a firm profile over the last decade of being incremental in maneuvering its policy tools except in times of crisis. For example, the last time the Fed raised the short-term rates that it directly controls by more than 25 basis points (bps) was October 2008, almost 14 years ago. Every Fed rate hike and rate cut between the Global Financial Crisis (GFC) and the COVID crisis was 25 bps.
See nearby chart. So, perhaps the perspective from which to view the likely trajectory and magnitude of the upcoming rate hike cycle is to first determine if the inflation stew in which we find ourselves is a crisis or not. Despite the four-decade high prints on inflation reaching into the high single digits, our forecast for inflation over the intermediate term has not changed from what we have articulated in prior quarters. While clearly not “transitory” (at least as that term came to be interpreted a year ago), we believe inflation is close to peaking at present and will show marked declines over the next year. In fact, one reason the curve has flattened is because the bond market believes inflation will be much more muted a few years out. Of course, the other reason could be that the Fed has still been buying bonds until QE completely ends in March.
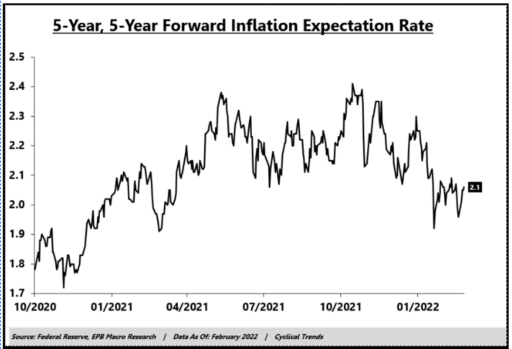
Inflation expectations in both the financial markets and consumer surveys are up from the steady state of just under 2% that prevailed for most of the last decade. The chart above shows what the forward bond markets is implying for inflation. Peak expectation for inflation in the forward bond market was in October 2021 at 2.4%, and it has been in a slow decline since to its current level of 2.1%. Bear in mind this chart was before the invasion of Ukraine (BI), which has driven the oil price up over $100 per barrel. And, our readers know how closely linked we think the price of oil is with the level of inflation. Additionally, global bond investors active in the forward swap markets have started to price in the Fed reversing its tightening course in late 2023. Looking at the December 2023 and December 2025 Eurodollar future contracts as of mid-February (before invasion (BI)), it appears markets are expecting a reduction in the Fed Funds rate. While that swap market signal is not striking in its magnitude, it does appear to mark an inflection point. A chart of these forward swaps can be found nearby. When the line in the chart goes negative, it means investors
think the Fed will begin lowering short term rates about two years out.
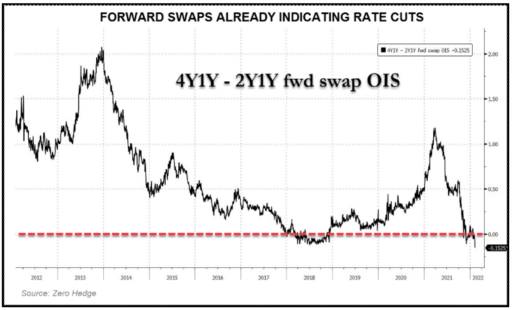
In a February 17th piece, Moody’s published the following: “…… there are other warnings in financial markets. Forward yield curves, which are constructed using interest rate swaps, are already flashing recession warning signs. The normal yield curves we look at, including the spread between the 10- and 2-year Treasury yields and the 10-year and 3-month Treasury yields, can be turned into 1-year forward-looking yield curves using forward contracts. The forward-looking yield curves have flattened significantly over the past year and are as flat as they were ahead of the 2007 and 2020 recessions. The lead time between where they are today, and a recession varies at around 12 to 24 months. This time, the Fed will likely be tightening when forward curves are sending a warning about a recession. Therefore, the odds of something going wrong are high.”
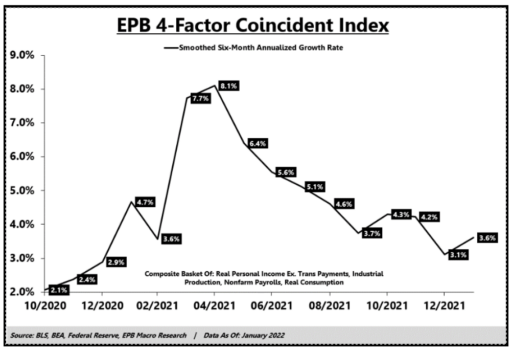
One important observation we have been passing on lately is the decline in the growth rate of the coincident economic indicators, which in the analysis of EPB Macro Research include indices of four factors: income, production, consumption, employment. EPB tends to be on the conservative side of the spectrum, but we believe their analysis to be quite thoughtful. A combination of those four factors currently shows the growth rate for the US economy having peaked in the Spring of 2021, and it has been significantly decelerating since, with a small uptick in the most recent data. See the nearby chart. Part of the recent uptick is a boost in utility output as cold weather struck the US during January, so it may not be sustainable. Regardless, it appears peak growth is convincingly in the rearview mirror.
A quick check on loan growth at US commercial banks, and its resulting impact on the Velocity of Money (V), a subject our readers know we track closely. We track it because the link between the growth in money supply (M2) and inflation is dependent upon V. Higher M2 does not necessarily lead to higher inflation if V goes down. As a reminder, we are at multi-generation lows for V.
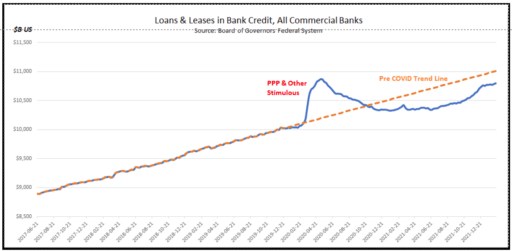
The most significant determinant of V is growth in the credits (loans and leases) generated by the banking system. There were some modestly hopeful signs as of last quarter’s report, but the pace seems to have abated a bit. And, as can generated by the banking system. There were some modestly hopeful signs as of last quarter’s report, but the pace seems to have abated a bit. And, as can be seen in the nearby chart, the total amount of loans and leases in the US banking system remains well below where it should have been if it stayed on its pre COVID trend. The orange line in the nearby chart is the pre COVID trend line, and after a burst from the PPP loans and other credit stimulus, loan growth turned negative, and the total outstanding loans and leases fell below the long-term trend and has yet to recover. The acceleration relative to trend that appeared last quarter, seems to be abating somewhat, which is not a sign of robust credit formation.
Conclusion – We believe that the Fed will raise overnight rates three times in 2022 beginning in March, 25 bps each time, then pause. Afterwards the Fed may experiment with some small reductions in the size of its balance sheet by letting some of its maturing securities roll off over the course of the late summer. A modest effort at QT. We may then get one more rate hike next winter, but at that point we think signs of the significantly slowing growth will be evident and both short-term and long-terms rates will likely peak. We are calling for a peak of 1.25% for overnight rates (Fed Funds, if such a thing actually exists anymore) and 2.5% on the UST-10.
One wild card to our forecast is the price of oil. If the war results in an extended period (6+ months) of oil prices much above $110 per barrel, then inflation will remain elevated, interest rates will peak at higher levels, and the next recession will arrive sooner.