Our team has been quite busy during the fourth quarter of 2017 and the first two months of 2018. The final closing of Fund III, multiple dispositions, a closed acquisition and a long pending acquisition which is finally back on track have kept us occupied. Details follow on those transactions. All of that activity has occurred across a back drop of what many are thinking is an inflection point in overall economic conditions. In what direction are we pivoting? Nobody knows for sure, but as our readers have likely guessed, we have some thoughts to share on that subject later in this report.
Fund Updates
Fund II completed the disposition of the two assets which had been under contract as of our last quarterly writing. The sale of Plano Corporate Center (Dallas) closed in December, and the sale of The Offices at Pin Oak (Houston) closed in January. Proceeds from each sale were distributed to all partners shortly after each transaction was closed. More details about the individual investment results can be found in the Manager’s Letter which follows.
With the January distribution of sale proceeds from Pin Oak, Fund II has now returned 111% of investors’ contributed capital. The total of all distributions through January has been $25.6 million. That means Fund II investors have received all of their money back plus an 11% profit within two years and one month of making the final capital contribution, AND they still own interests in five assets. Those five assets have a net asset value at the end of Q4 estimated to be $8.1 million, which equates to a multiple of approximately 1.5 to date.
Fund III completed the acquisition in January of a mixed-use property in the West Denver suburb of Lakewood, CO. The property is 94% leased with both office and retail tenants. This currently stabilized core-plus investment also has a potential future development component that could provide additional profit opportunities. The clouded title issue has finally been cleared on the large, three building office project in Houston known as Loop Central which Fund III has had under contract since last summer. Due diligence is wrapping up very soon, and this acquisition transaction will close by the end of March.
In the last week, Fund III executed a purchase contract to acquire an office property in Charlotte, NC. Our team has spent a significant amount of time in Charlotte, and we are hopeful that this well leased and superbly located suburban office property will be the first of several opportunities to capture a return on that invested time.
Real Estate Market Conditions
The now well-defined trend of declining CRE investment sales volume was confirmed on an annual basis when the fourth quarter numbers were posted. We spent a fair amount of ink last quarter on the subject and won’t linger long this quarter. As can be seen in the nearby graph, total CRE property sales fell 7% in 2017 when compared to 2016 and 15% in total from the peak in 2015. Meanwhile, prices, as tracked by the Moodys/RCA Commercial Property Price Index (CPPI), continued an upward trajectory, rising by 7% in 2017. Our more frequent readers will recall that we believe the aggregate CPPI is a somewhat flawed index, masking large differences in price trends between property types, locations and markets. Regardless, it is reasonable to conclude that CRE values have been stable despite the decline in transaction volume. All major property types saw volume declines, except industrial which is the current market darling and therefore saw a volume rise of 20% in 2017. Retail and hospitality were the biggest decliners, both in double digits. Office and multi-family posted declines of 8% and 7%, respectively. Interestingly, major metros saw a larger decline at 14% than secondary markets, down![]() only 2%. Remember, all of our target markets are considered “secondary markets” by RCA, despite some of them being quite large. And even more interesting, the decline in office volume was solely attributable to CBD office, as suburban office posted a slight increase in volume. Hmmm……, perhaps a small sign, as we have speculated in the past, that the CBD stampede may be tapering off.
only 2%. Remember, all of our target markets are considered “secondary markets” by RCA, despite some of them being quite large. And even more interesting, the decline in office volume was solely attributable to CBD office, as suburban office posted a slight increase in volume. Hmmm……, perhaps a small sign, as we have speculated in the past, that the CBD stampede may be tapering off.
The magnitude of volume declines and relatively firm pricing make this period a bit unique, and markedly different than the downturn a decade ago, at least so far. Buyers are simply more cautious, but not in full retreat as they were in 2008. Such caution is appropriate at this point in the CRE cycle, as the brisk tailwinds of falling CAP rates and broadly rising rents have abated. Sellers have been slower to adjust to changing conditions, and as a result, the gap in pricing expectations has widened, making deals much harder to complete.
Similar to sales volumes, 2017 was a year of declining new construction volume as well. A majority of the largest US MSA’s experienced reduced activity for commercial and multi-family construction starts in 2017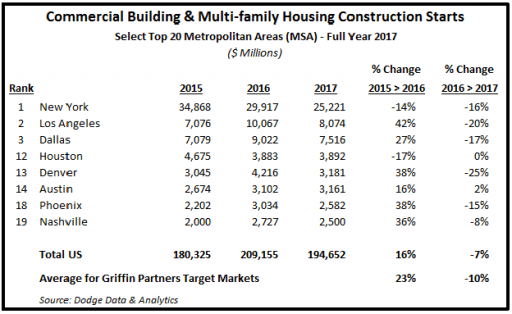 as compared to 2016, according to Dodge Data & Analytics. Nationally, the volume CRE construction starts in 2017 was down 7% from 2016, mostly due to declines in multifamily. 2017 CRE construction starts were still 8% above the activity level for 2015. A chart showing selected top 20 markets including most of the target investment markets of ours can be found nearby. We threw in New York and Los Angeles, the two highest volume markets, for comparative purposes. In comparing the change in construction activity between property types, Dodge Data & Analytics chief economist Robert A. Murray says: “Of the commercial and multifamily project types, multifamily housing is the one that appears to have already reached its peak and is now heading downward, as shown by the 12% decline in dollar terms during 2017.”
Dodge also has a forward-looking index which we have periodically referenced in past reports called the Dodge Momentum Index. From the Dodge website: “The Momentum Index is a monthly measure of the 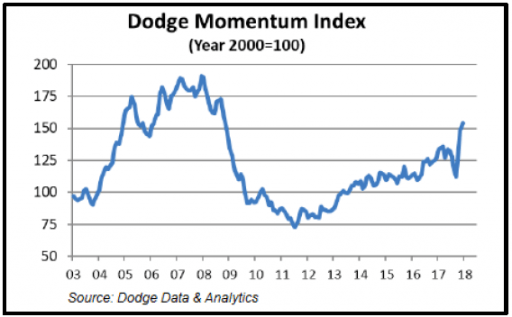 first (or initial) report for nonresidential building projects in planning, which have been shown to lead construction spending for nonresidential buildings by a full year. For the full year 2017, the Momentum Index averaged 132.3, up 10.7% from the full year average for 2016, with similar improvement for the commercial sector (up 11.4%) and the institutional sector (up 9.7%). After retreating during the third
quarter of 2017, the Momentum Index regained its upward track in the fourth quarter, which enabled December’s reading for the Momentum Index to be up 20.9% compared to the same month a year ago.” The Momentum Index did not move much from the middle of 2016 until Q4-2017, signaling perhaps the slight decline in construction starts recorded in 2017. However, if the fourth quarter leap in the Momentum index is any indication, then 2018 should see a resumption of growth in CRE construction activity. An increase in construction activity assumes private developers can arrange construction financing, which as we have been reporting for several quarters now, has become increasingly difficult.
Running somewhat counter to what we have been observing, Nation Real Estate Investors (NREI) states that 2018 will see the highest level of speculative office construction as a percentage of the new supply since the recession. According to NREI and CoStar, approximately 40% of the 120 million square feet of office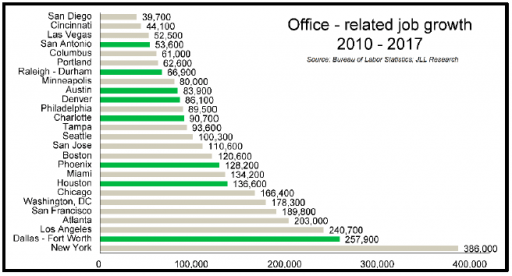 space under construction nationally is not preleased. We believe that this speculative office development is likely concentrated in a few markets where for the moment, hyper demand has pushed rents well beyond replacement cost rent levels. We are certainly watching that trend closely. Our most recent office acquisition, as well as our two office properties currently under purchase contracts, are all in sub-markets where there is very little office construction and zero speculative office construction. In those submarkets, rents are well below replacement cost giving us confidence that rents still have room to rise.
Total office deliveries for 2017 nationally were 93 million square feet (CoStar), up slightly from 86 million in 2016 and 87 million in 2015. All three recent years saw deliveries well below the thirty year average of 150 million square feet annually. In evaluating the impact of new office deliveries, one should examine the geography and sustainability of the demand generators for new office supply, namely new office job creation. A quick glance at the nearby chart showing new office job growth for the top US markets confirms robust new office job creation is occurring, and broadly speaking, the new CRE deliveries we saw in the chart on the previous page are happening where the new office job creation is highest.
Total industrial deliveries were 317 million square feet (CoStar), which unlike office deliveries, exceeds the 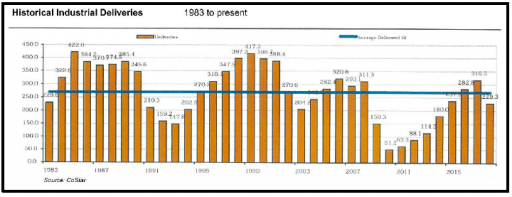 30 year average of 270 million square feet and represents a peak level since the recession. CoStar is forecasting a marked decline in industrial deliveries to 229 million square feet nationally for 2018. (See nearby chart).
One of the factors we track closely to guide our CRE investment strategy is demographic data. We recently came across a chart which reinforces our current target market selection. The chart, which can been seen nearby, shows the top ten and bottom five US states for net migration. All of our target markets are in states appearing in the top ten, including the states ranked two, three, four and five. As we have said probably too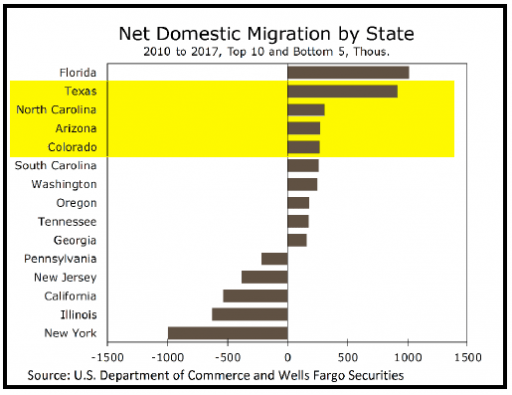 often, real estate exists to hold people and stuff. The more people the better for real estate demand. And, the stuff usually follows the people! The economic discussion that follows contains some thoughts about the prospect of rising interest rates, and there is certainly widespread agreement that short term interest rates will rise some in 2018. Accordingly, we thought it appropriate to provide a brief discussion about what real estate investors can do to mitigate potential adverse impacts from rising interest rates.
First and foremost is a conservative use of debt financing. We are so adamant about this principle, that it is one of only two covenants in our fund level partnership agreement. The covenant precludes any debt in excess of 65% of a projects total costs. We also align the type and duration of debt financing to the projected holding period and business plan for the asset. Mezzanine debt is never used to finance a property. We almost always borrow on a non-recourse basis, set up unique special purpose entities for each transaction, and never cross collateralize any assets. This approach ensures that in the unlikely event something goes very wrong, the lender only has recourse to the individual asset and not any other assets of the fund or any of it partners, principals or sponsors.
During initial underwriting prior to acquisition and periodically during the hold period when we formally review asset performance, an evaluation of the impact of multiple adverse circumstances, including rising interest rates, is performed. We stress test each investment by running pro forma cases with higher interest rates and higher cap rates to determine the impact on cash flows and valuation. In addition, particularly recently, we consider fixed rate financing options or enter into interest rate hedge arrangements including swaps and caps. We tend to prefer floating rate financing with an interest rate cap that is set a few hundred basis points higher than current rates. Typically, a cap is less expensive but still provides “insurance” against a large spike in interest rates. Fixed rate loans and swaps, which effectively turn a floating rate loan into a fixed rate loan, provide more interest rate certainty but can be expensive to exit or unwind if we sell an investment earlier than anticipated. Our most recent acquisition in Denver, and our pending acquisition in Houston will both have interest rate caps.
Our objective is always to build value in every property. Higher values are a natural cushion to absorb any negative impacts from rising rates, and maintaining appropriate cash reserves is a critical strategy for ensuring that our investments can weather any storm, including higher interest rates.
Macro-Economic Conditions
Shortly after publishing our overly long missive on the Phillips Curve last quarter, the following occurred to us: Phillips Curve = PC, and PC = politically correct, and furthermore PC = popular convention. No wonder PC economic theory assumes the existence of a tradeoff between employment and inflation. At present of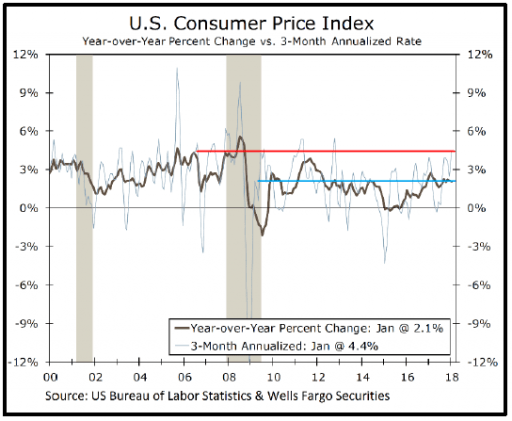 course, PC (insert your own words for this abbreviation) thinking has created a small “freakout” over the prospects for incipient inflation, a concern that is causing market volatility across the board, including some consternation in the CRE markets. Those following our thoughts on this macro-economic subject know that we fall outside the PC camp and tend to believe that sustained inflation is more often a function of major dislocations like war and severe commodity price shocks (read oil). We won’t repeat last quarter’s arguments on that score, but we will take a look at recent inflation readings and their likely impact on interest rates and the shape of the yield curve.
The chart above showing changes in the Consumer Price Index (CPI) through January 2018 is interesting in a number of ways. Wells Fargo economists like to use a 3-month moving average for changes in CPI, 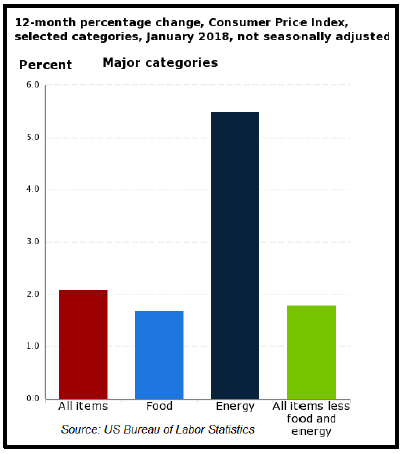 as well as the year-over-year (YoY) rate of change because they both smooth out monthly volatility and occasional aberrations. Looking at the 3-month annualized rate of change, which gives a better read on recent trend, it certainly makes a case for concern, clocking in at 4.4%. The YoY number is a bit less concerning at 2.1%. However, looking to the left from the current readings, it is clear that neither of the January figures are highs for this economic recovery cycle. The 3-month annualized is the highest since 2013, but the YoY figure of 2.1% is meaningfully below the recent peak in early 2017. Since this Wells Fargo chart is headline CPI, which includes the more volatile food and energy categories, it is likely that the initial recovery in oil prices led to the early 2017 YoY peak. In fact, the recent January 2018 also was impacted by rising oil prices as can be seen from the bar chart on this page.
Regardless of whether one falls into the PC camp or not, there is near-unanimous consensus that short-term interest rates will rise in 2018. There is much less consensus on what will happen with longer term interest rates. Will the whole interest rate curve move up, or will the curve flatten as any rise in long term rates remains more muted? Signs of accelerating GDP growth, including record-high consumer confidence amidst low unemployment, rising wages, and a big tax cut, surely point to rising rates across the curve, right?
Well, there are some countervailing trends and non-consensus perspectives on some of the aforementioned signs. For example, the team at Hoisington Investment Management did a regression analysis to assess the correlation 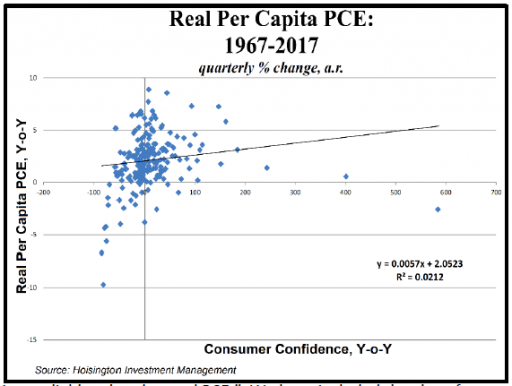 between consumer confidence and future personal consumption expenditures (PCE), a fancy term for consumer spending, which of course is approximately 70% of GDP. Hoisington: While “conventional wisdom suggests that rising consumer confidence significantly boosts spending, plotting the quarterly percent changes in real per capita PCE against percent changes in consumer confidence from 1967 through the third quarter 2017, it appears that consumer confidence is unreliably related to real PCE.” We have included the chart for any geeks out there who get excited about regression analysis. While there is a correlation, Hoisington says “over this very robust sample of 202 observations, a 1% gain in confidence only boosts real per capita PCE by a minuscule 0.006%. While the correlation is positive, the relationship is not statistically significant with a coefficient of determination (R2) of only 0.02.”
Sticking with Hoisington for a moment, the team there is convinced that Fed tightening is already much greater than the consensus believes, with QT (quantitative tightening – balance sheet reduction by the Fed through the run off by maturity or sale of assets) likely to turn monetary (M2) growth negative by the end of the year. We have been pointing out for that past two years that the velocity (turnover) of money is at a multi-decade low, and if velocity does not accelerate and monetary growth slows further or turns negative, by mathematical definition GDP growth will decelerate and the yield curve will likely further flatten. Hoisington: “The full spectrum of monetary policy is aligned against stronger growth in 2018. A higher federal funds rate, the continuation of QT, low (monetary) velocity and abruptly slowing money growth all put downward pressure on (GDP) growth. The flatter yield curve will further tighten monetary conditions. This monetary environment coupled with a heavily indebted economy, a low- saving consumer and well-known existing conditions of poor demographics suggest 2018 will bring economic disappointments. Inflation will subside along with growth causing lower long-term Treasury yields.”
For the last point on the non-PC side, we include our favorite chart which readers have seen almost every quarter. Loan growth at commercial banks continues to decelerate. As goes loan growth, so usually goes economic growth. Loan growth rates are about the same as last quarter, but down more than half from the rate of growth seen 12 and 18 months ago.
A balanced perspective is important, and to be sure, the majority of economists are more optimistic about growth in 2018 and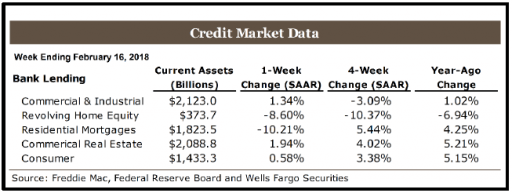 2019. Their case is predicated upon high levels of consumer confidence translating into more spending despite the low savings rate as people either borrow or liquidate appreciated assets. Also, a recent trend towards improvement in real disposable personal income growth, partly as a result of tightening labor markets and partly from lower tax rates, should support consumers and allow for more growth in spending.
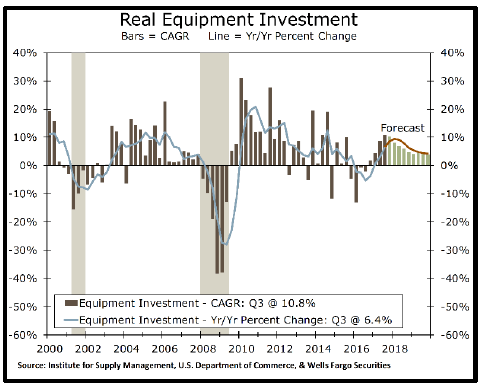 Rising incomes are not necessarily inflationary as employers could absorb higher labor costs by accepting lower margins, or by improving productivity. As we have noted in the past, productivity has been in a long slow descent for several decades, but there is some hope among the set of optimists that tax cut induced capital spending will finally show some muscle after having been anemic for most of this recovery. Significant increases in capital investment could improve productivity and reverse its long decline. Indeed, even before the tax cut, the growth rate in equipment investment has improved dramatically over the lows experienced in 2015 and 2016, which were meaningfully impacted by the precipitous decline in oil and gas drilling activity. This improvement can be seen in the nearby chart of Real Equipment Investment. Another view of capital expenditures can be found in the Fed Regional Survey’s Capital Expenditures Index which recently posted the highest reading in almost 20 years over two economic cycles. It is certainly a compelling illustration of the optimistic case for improved productivity.
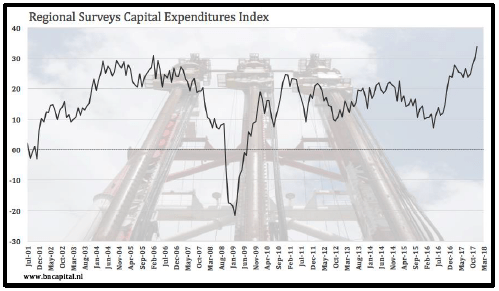
Inflation expectations, an important element in economic theory initially developed as partial rebuttal to Phillips Curve theory, remain grounded at a relatively low level. This should help contain inflation in the intermediate and longer term. In the benign version of this expected scenario summarized in the previous few paragraphs, inflation will rise modestly into the second half of 2018, then begin to moderate as the impact of higher recent energy prices fades.
Taking all perspectives into balance, we have slightly adjusted our forecast for long term interest rates. Several quarters ago, before the election, we predicted that the 10 year US Treasury bond would not eclipse 3.0% prior to the next recession. There is rumor afoot that some wagers may have been made around that prediction. We are adjusting that prediction upwards by 25 basis points to 3.25%. If 10 year rates do reach 3.25%, one or more of those wagers may be lost……