The third quarter was rounded out with incessant rhetoric, a bit of vitriol, and little consensus across the aisle within our two-party political system. Thankfully as we write, the intensity of the political season has begun to ebb. In contrast with the vigor of recent political debate, the Fed has reversed its “stranglehold” policy of keeping rates “higher for longer” signaling we may have turned the corner on this rate cycle. For many market participants, the Fed move allows for a proverbial “sigh of relief” as the Fed Funds rate has moved down 75 basis points since we last provided our thoughts in Q1-2024. We can all agree that it’s generally a good thing for real rates to settle and provide some much-needed positive direction for the CRE universe.
In this report we discuss capital flows and specific sectors through the first half of 2024 compared to this time last year. As we’ve preached in the past, transaction volume is a critical indicator of market health. Lastly, we will provide a few takeaways from thought leaders and statistics on the overall improvements in the office sector, from leasing demand and recent trades, to specific progress on return-to-work policies.
The Table of Contents below can assist with navigating to a preferred section or getting a quick general take.
- Fund Updates: High level news on Fund activity.
- Real Estate Market Conditions: In this section, we will review:
- Capital Flows & Value change in CRE sectors
- Office Sector: Turning the page on demand...and trades increasing?
- Macro Economic Conditions:
- Crying Wolf? Does the Index of Leading Economic Indicators (LEI) Still Have Meaning?
- Rate relief, or head fake?
- Yield curve control? Surely not in the U.S.?
Fund Updates
Fund IV:
Airport 6, Charlotte, NC: As we reported last quarter, a major tenant lease renewal at Twin Oaks (a two-building industrial flex project within Airport 6) was completed to stabilize the rent roll providing an adjusted 3.4 year WALT. Upon executing this major tenant lease, CBRE Capital Markets offered the building for sale considering the recent stabilization. A few offers were received, although they have yet to meet our pricing expectations. While not what we expected, this asset provides strong cash flow for the portfolio, thus providing funds to cover leasing costs incurred in stabilizing the other properties in the portfolio and also assure all our debt covenants remain in good standing.
Saturn Crossing, Nashville, TN: The strong leasing momentum for this industrial asset has continued, and it is now 67% leased with four (4) tenants. Executed leases total approximately 136,000 square feet. The leasing pipeline is robust, and we are currently trading proposals with tenants for the remaining +/-68,000 SF of vacancy in Building 1. The configuration of the contiguous vacancy in Building 1 makes it possible to lease to a single tenant or multiple tenants.
Carter Crossing, Houston, TX: Construction at the building continues to run smoothly with substantial completion expected at the end of December 2024. As the building begins to take shape, tenant prospect activity has continued to increase. Basic terms have been agreed with a credit tenant to take the entirety of the building in the 1st quarter of 2025. The lease is currently being documented. Once this is finalized, we will share that information in our next quarterly report, fingers crossed.
Buckhorn Logistics, Raleigh, NC: We closed on the land for this project in August and began sitework later that month. Our contractor is currently working on clearing trees, constructing detention ponds, and prepping for the stream crossing. CBRE is engaged as the 3rd party leasing team, and they are preparing brochure materials for leasing prospects.
Earhart Logistics, Nashville, TN: The horizontal and vertical general contractors both continue to work through construction of the two massive buildings. The horizontal contractor is presently engaged in grading, excavating and building the pad for Building 2, and installing utilities at the site. The vertical contractor continues to make progress on Building 1, and has completed pouring the slab, tilting walls, and installing the roof. Building 1 is anticipated to deliver in Q1-2025, and Building 2 is anticipated to be delivered in Q4-2025. We are receiving inquiries from large Fortune 500 tenants interested in occupying the buildings. The leasing team, Foundry, is responding to these inquiries in a timely manner.
Real Estate Market Conditions
The following are our latest observations on current commercial real estate (“CRE”) market conditions.
Capital Flows & Value Changes in CRE sectors:
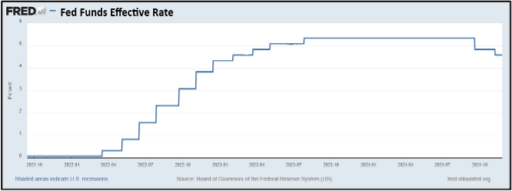
As we tend to highlight every few quarters, capital flows in CRE are a vital metric in measuring the health of the overall CRE market and individual sectors. In 2020 and 2023, CRE transactions had a “high fever”; said differently, the “tide was out” and trading volumes were historically low in those two years. Volumes were low for various reasons, including a worldwide pandemic, massive amounts of money (trillions!) pumped into the “system”, major supply chain and demand issues throughout the world, and rapid inflation. To address the inflation (apparently it wasn’t “transitory”) the Fed dosed the economy with a rapid rise of short-term interest rates from effectively 0% to just over 5.25% (1Q22 – 2Q23, see Fed Funds Effective Rate graph below). All the above contributed to major swings in CRE trade volumes (see chart below).
Since the spring of 2024, empirical data has shown improvements in transaction volumes. Anecdotally, capital markets peers are indicating a broad optimism for better times ahead in 2025. As you can see in the next graphic below, total U.S. transaction volume, per Green Street, capital flows are starting to reemerge for the first half of 2024. Digging deeper into the data, comparing 2Q2024 YTD transaction volume to the same period in 2023, overall CRE trade volume is up 9%, per Green Street. That is good news!
- Trade volumes across the first half of 2024 reached $173 billion which equates to over 70%, and just under 60% of ALL trade volume for 2020 and 2023, respectively. Green Street: “…. assuming no material deterioration in the broader economy, the more favorable interest rate environment…will bode well for transaction volume.” We remain optimistic that short-term rates will continue lower by ~100bps with the Fed cutting over the next 12 months (see Macro Economic Conditions discussion below). The rate cuts will help and provide a leading indicator for things to come, and the lending environment should continue to thaw alongside easing financial conditions, thus increasing transaction volume and allowing for healthier years ahead.
Click here to request the full Q3 2024 Report.
![]()
- Overall cap rates have stabilized and in some segments of CRE are compressing, which is a lagging indicator of pricing efficiencies and overall growth in transaction volume. It is usually about 120+ days before the data collectors and published reports catch up with the comps we track. In the next couple of years, CRE sectors (excluding office) are likely to hit pricing efficiencies reminiscent of 2015 through 2019. Hence, we see asset values increasing across all sectors in the next 24 to 36 months. We will not see another year like 2021’s record trade volume for several years, but it would not be surprising to see the 2021 volume exceeded in next 5 years. Everything costs more, right?! With a new administration that is bullish on real estate, low tax policy, government deregulation to promote job growth, trade, etc… we will likely see another run up in the CRE pricing indexes before the end of the next presidential term.
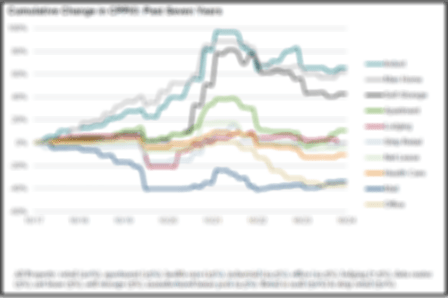
A common theme of late across CRE is the consistency of property values in a few key sectors, including Industrial, Manufactured Housing, Self-Storage and one other that is not listed specifically within the Commercial Property Price Index (“CPPI”), Data Centers. GreenStreet produces this CPPI on a quarterly basis, and it provides an excellent gauge of the health of various CRE sectors. As you can see from the table nearby, since 2020, there has been a dramatic rise in the property prices for these three sectors (setting aside Data Center). These specific sectors are leading the overall CRE world not just in terms of pricing but also trade volume. In our opinion, these sectors will not be able to prop up the wall of capital sitting on the sidelines to generate the previous pre-Covid total CRE transaction volumes. These three sectors are the darlings of the institutional investment world today and have been for the last 24+ months, as evidenced by their relative outperformance in terms of asset values. There are several reasons for the outperformance of these three product types, including :1) each of these sectors has limited future releasing costs, consistent and predictable cash flow, and demand drivers that will continue to support values, and 2) large institutions are not buying office and are a bit sheepish on the overall health of the multi-family sector.
Therefore, to balance their real estate capital allocations, Industrial, Manufactured Housing, Self-Storage and Data Centers are experiencing a disproportionate share of institutional capital flows and consistently strong pricing with little fluctuation to the downside. This euphoria cannot sustain itself as only so many of these assets within these sectors can trade, and when pricing efficiencies hit highs (read excessive cap rate compression), institutional capital will begin to warm up to other sectors chasing higher yields (better cap rate spreads) such as multi-family (we can hear that drum beat beginning now) and eventually retail and lodging. Lastly, Office CPPI has suffered the most since the Fed Fund rate increases. As you can see in “tan” line moving from left to right across the graphic, values have consistently remained depressed by upwards of 35% for more than a year. While it will take years to improve, we are starting to see positive signs for the overall Office environment which we touch upon next.
Click here to request the full Q3 2024 Report.
Office Sector - Turning the page on demand….and trade volume slowly increasing?
- CBRE recently said in its Q3 earnings report “… better than anticipated results drive a nearly 18% gain in third quarter earnings” primarily due to “global office leasing that exceeded expectations as more businesses decide to rent higher quality space” per CoStar’s Candace Carlisle. CBRE President, CEO and Chair Bob Sulentic told investors during earning calls a few weeks ago “Key drivers included our resilient business units….as well as leasing, which posted 19% revenue increase fueled by accelerated office demand.” This is good news for those assets across the country that have made the decision to improve their properties as employers, including the federal government, are forcing their employees back to the office. CBRE’s CFO, Emma Giamartino, said “….global office leasing revenues for CBRE increased 26%, reaching a third quarter record for brokerage, led by the Americas and Europe and the demand for high-quality office space as employers lure workers back to the office.” Lastly, Mr. Sulentic went on to say in CBRE’s latest earnings call that “….capital markets transaction activity has passed an inflection point and is in the early stages of recovery.” We couldn’t agree more with one of the largest real estate services companies in world; the ship is turning on the Office sector, albeit slowly, but it’s at least, turning, in the right direction.
- Globest.com reports office assets located in places which have a relatively strong corporate tenancy profile (places such as New York and Miami) are “leading the office sector’s recovery” (Kristen Smithberg article “Office Visits Reach Highest Level Since 2020”). While offices visits are still below YE2019 levels, they are trending upward to “highest levels we’ve seen since February 2020, according to Placer.AI. office sector analysis.” Corporate tenants such as Amazon, Dell, Goldman Sachs, Walmart and UPS all have corporate policies to be in the office a minimum number of three to as many as five days per week, and it’s starting show in the data. In Washington D.C., office visits “increased 16.4% year-over-year, as the return to office push increases…at federal agencies.” Lastly, regional office visit data shows that “…October 2024 was the single busiest in-office month since the pandemic in Atlanta, Dallas, Houston, Denver, Washington D.C., Chicago and San Fransico.”
- This is not new news but CEOs across the globe are pushing to have their employees in the office. The KPMG CEO Outlook Survey which polls hundreds of CEOs across various industries gives us a glimpse into how leadership wants employees back in the office to collaborate, mentor, and create better productive outcomes in short periods of time versus working remotely. Most notably, per KPMG’s latest 2024 survey there has been a dramatic uptick in return to office mandates not just for employees in general but for age groups and gender. Below is a brief “snip-it” from the latest KPMG survey “….CEOs are hardening their stance on returning to pre-pandemic ways of working, with 83 percent expecting a full return to the office within the next three years — a notable increase from 64 percent in 2023. And this expectation only increases with age: 75 percent for those aged 40 to 49, 83 percent for those aged 50 to 59, and 87 percent for those aged 60 to 69. Interestingly, there is also a gender split emerging in this debate: while 84 percent of male CEOs predict a full return to the office within three years, only 78 percent of female CEOs anticipate the same shift back. Furthermore, 87 percent of respondents say they are likely to reward employees who make an effort to come into the office with favorable assignments, raises or promotions.” This last segment we’ve reported on in previous quarterly reports, which is the “FOMO” (fear of missing out) factor as executives, leaders, mentors, etc. within an organizations will promote and provide more incentives to those employees that are in the office versus not. We used to call it “out of sight, out of mind…!”
- Most recently, office market buyers (mostly family offices and ultra-high net worth capital sources) have started to lean back into the market as a few large institutions have capitulated and are willing to sell higher quality office assets. This trend will slowly continue as more institutions decide to sell or their lenders make this decision for them and buyers will take notice. A real-time example of an institutional trade, per CoStar’s Katie Burke, is Invesco’s decision to sell a recently developed Class AA office property in Charlotte, NC., Vantage South End East & West. This two-building +/-640,000 sf project, currently 98.5% leased developed in 2021-2022 is under contract to sell to Cousins Properties, an Atlanta based real estate investment trust, for approximately $328,500,000 / $525psf which translates to an estimated cap rate of +/-8.5% cap rate based on $45.00 psf net rates. A few of the major tenants include Lending Tree, Grant Thorton International, Accenture, The Hartford, and Holland & Knight as well as various other financial services companies. Per Collin Connolly, CEO, Cousins Properties “…remains focused on identifying compelling opportunities to invest in highly-amenitized lifestyle office assets…” As mentioned herein, we should begin to see more office trades occur in the next 12 months, not just to private capital or high net worth buyers, but institutional capital will gradually come back to the market similar to Cousins recent announcement above.
Macro-Economic Conditions
Crying Wolf? Does the Index of Leading Economic Indicators (LEI) Still Have Meaning?
The LEI dropped to 99.5 in October, a level not seen since 2016. September marked the first time the index has been below 100 since 2016. The LEI has declined every month for 31 consecutive months (see nearby chart). As first pointed out in our Q4-2023 report, “Since 1959, there have been no declines of similar duration in the LEI not associated with a recession. Could the LEI turn up again? It has happened twice before. Once in the mid-1960’s and then again in the early 2000’s, right after the 2001 downturn. However, in both those cases, the downturn in LEI was much less pronounced and of significantly shorter duration.” Currently, the LEI sits in stark contrast to the strong growth turned in by the U.S. economy in the 2nd and 3rd quarters of this year. So, does the LEI have a credibility problem?
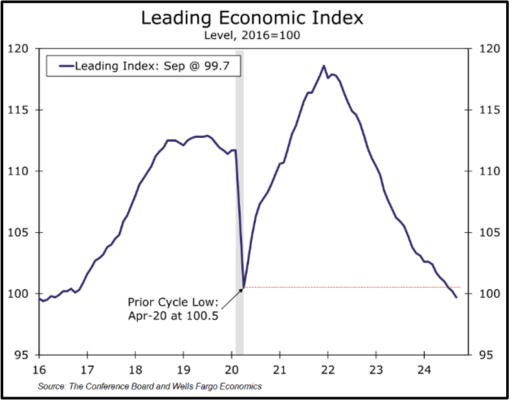
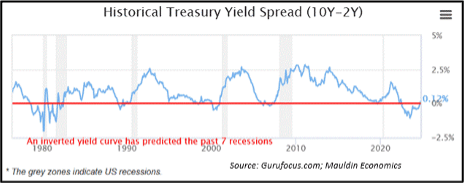
The economic team at Wells Fargo believes it does. In a recent article, they point out that the LEI has been in persistent decline for over two and a half years, despite the broader economic outlook improving. They believe that since the LEI's performance has conflicted with other economic forecasts, including those from the Federal Reserve, it is no longer a reliable indicator of future economic conditions. The largest negative contributors to the index over the past two years have been ISM new orders (weak manufacturing but healthy services), the interest rate spread component (inverted yield curve) and consumer expectations. The yield curve is in the process of de-inverting, and for more than a month the 2-year and 10-year yields have been within a few basis points of each other. As such, the interest rate spread should cease to be a drag on the LEI index as the Fed continues to lower short-term rates. But the Fed typically only lowers rates when the FOMC concludes the economy is weakening. (See more on future Fed policy below). And the yield curve always de-inverts right before recessions (see nearby chart). Our view, LEI is less reliable….until it’s not.
Rate relief, or head fake?
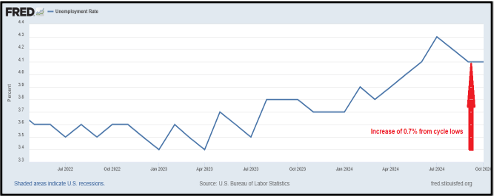
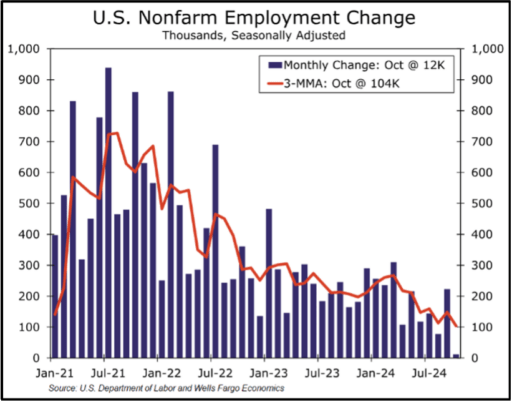
Many economic observers believe that inflation has not been truly conquered and may be likely to rebound from the headline 2.3% YOY October read of the personal consumption expenditures (PCE) index. Falling energy (mostly oil) prices have helped move the headline PCE lower. The core PCE (ex. food & energy) stood at 2.8% YOY in October, meaningfully higher than the headline number. Despite concerns from some economists and market participants about an inflation rebound, Fed rhetoric has shifted to focus on the other part of the Fed’s dual mandate, namely employment. The rise in U-3 (the most widely published unemployment rate) from cycle lows in Q1 of this year is the most likely reason the Fed has lowered overnight rates by 75 bps over its last two meetings (see nearby chart). While still low compared to historical averages, the recent rise in unemployment is notable and a clear indication of a softening labor market. Even though the October U3 read was unchanged, the establishment job growth survey was particularly weak, quite likely because of distortion from the two October hurricanes. The soon to be released November establishment survey should show a rebound, but unless there is a sustained change in directional momentum, the downward trend in job creation is unmistakable, as can be seen in the nearby chart. The unbroken streak of positive job growth however does show there is little evidence that businesses are rapidly shedding workers.
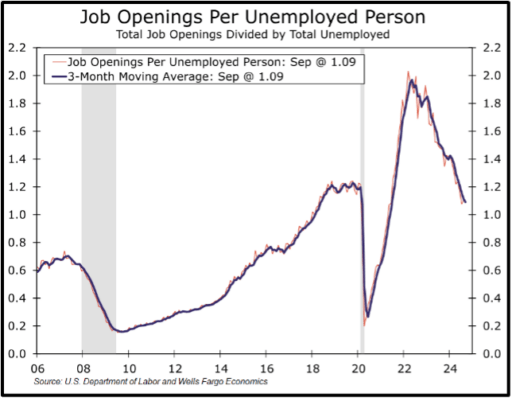
The number of job openings per unemployed person as of the end of September as reported in the JOLTS report (Job Openings & Labor Turnover Survey) held steady at 1.1, down significantly from a peak near 2.0 in 2022. The total number of job openings fell by 418,000 to a 7.4 million (see nearby chart). The share of workers quitting their jobs fell to a four-year low in September. Layoffs, although ticking up slightly, remain near historic lows. The quit rate fell to 1.9%, below the 2.3% rate of 2019. The data seems to indicate a labor market softening from an overheated state several quarters ago to an approximate equilibrium at present. However, because most businesses adjust their staffing relatively slowly and often with a lag, employment (and conversely unemployment) tends to move with momentum and trends are usually slow to change. The economic soft-landing case all of us are hoping for will be highly dependent upon whether the labor market can remain in its recently achieved equilibrium, or whether the downside momentum will carry it into negative territory. We will have to wait and see if the post-election “animal spirits” we have seen in the equity markets spills over into the job market.
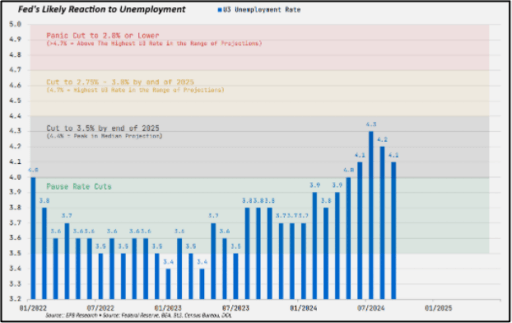
EPB Marco Research believes the unemployment rate is likely to “continue increasing in the months and quarters ahead because of the momentum that is passing through the Business Cycle Sequence from Leading [remember LEI from above] to Cyclical data.” The Cyclical Economy includes residential construction and manufacturing, which are both contracting at present. EPB forecasts that a resumption of the increasing unemployment rate trend will cause a repricing of the terminal rate expectations back into the upper 2% range (meaning the end point of the lowering cycle for overnight rates). The chart nearby shows EPB’s projected likely interest rate outcomes for given ranges of unemployment. Our forecast currently has one-month term SOFR (usually on top of the Fed Funds rate) between 3.25% and 3.5% at the end of 2025. The current Fed dot plot for the end of 2025 is 3.5%, and the market forward curve is 3.85%, down slightly from approximately 4.0% on election day.
Yield curve control? Surely not in the U.S.?
So, if the Fed and other central banks proceed to lower short-term rates over the coming quarters, what will happen to the long end of the interest rate curve? Some evidence suggests there is resistance from the market to absorb new issuance with long duration, but most pundits think long rates will eventually follow short rates down. However, there is growing concern amongst a significant but still minority portion of the economists we follow that long rates will not follow short rates down naturally (market driven) and global central banks will have no choice but to resume buying the massive amounts of debt being issued by governments as part of a policy approach commonly referred to as “financial repression.” We asked AI (Microsoft Copilot) to summarize financial repression, and this is what we got (links are active for those with inquiring minds):
Economists generally define financial repression as a set of government policies that channel funds from the private sector to the government to reduce public debt. This often involves measures like keeping interest rates artificially low, imposing capital controls, and directing credit to specific sectors12. [Griffin TEAM – You mean similar to the 14 years between the Global Financial Crisis and when the Fed finally started raising rates in 2022?!]
Key points from economists’ perspectives include:
- Origins and Definition: The term was introduced by Stanford economists Edward S. Shaw and Ronald I. McKinnon in 1973 to describe policies that suppress economic growth in emerging markets1. These policies can include interest rate caps, high reserve requirements for banks, and restrictions on capital movement1.
- Mechanisms: Financial repression can involve direct lending to the government, caps on interest rates, and regulations that create a captive market for government debt1. For example, banks might be required to hold a significant portion of their assets in government bonds1.
- Consequences: While these measures can help governments reduce debt, they often come at the expense of savers, who earn returns below the inflation rate, thus losing purchasing power1. This can also lead to inefficient allocation of resources, as funds are diverted from productive private-sector investments1.
- Historical Context: Financial repression was common in many advanced economies after World War II and has been suggested as a tool to manage debt following the 2008 financial crisis and the COVID-19 pandemic23.
- Modern Applications: Economists like Carmen Reinhart and Kenneth Rogoff have discussed the potential return of financial repression as a way to manage high public debt levels in the current economic climate34.
Overall, while financial repression can be an effective tool for debt reduction, it often has significant drawbacks, particularly for savers and overall economic efficiency.
It is very interesting that the AI answer incorporated a reference to the period after World War II. The U.S. has indeed previously practiced yield curve control during and after WWII, which not coincidentally was the last time the U.S. had a sovereign debt to GDP ratio over 100%. Here is a very detailed piece by the Richmond Fed about that period. A few summary takeaways from it:
In April 1942, after the entry of the United States into World War II, the Fed publicly committed itself to maintaining an interest rate of 3/8 percent on Treasury bills. In practice, it also established an upper limit to the term structure of interest rates on government debt. The ceiling for long-term government bonds was 2 1/2 percent. In summer 1947, the Fed raised the peg on the Treasury bill rate. However, the Treasury adamantly insisted that the Fed continue to place a floor under the price of government debt by placing a ceiling on its yield.
After World War II, the predominant concern of public policy was to prevent a return of the Great Depression and high unemployment. However, the primary postwar problem turned out to be inflation rather than economic depression. Over the 12-month periods ending June 1947 and June 1948, respectively, CPI inflation was 17.6 and 9.5 percent.
Wow! What’s the saying? History doesn’t repeat, but it sure can rhyme!
So, what is the way out of the financial repression trap if we find ourselves in it? Answer, a lasting increase in productivity, which has been showing signs of improvement in the U.S. post-COVID and drives higher real GDP growth, and some sustained meaningful effort to curtail government budget deficits, which will be tough, despite the best efforts of the DOGE.