The commercial real estate (CRE) market is currently undergoing a significant transformation, referred to in some corners as the "Great Reset." A year ago, we noted in our 3Q2022 report that the CRE markets were at an abrupt turning point. Today, we're witnessing the effects of this shift in the capital markets, primarily driven by inflation and the rapid increase in interest rates. Banks, life insurance companies, and other credit providers have become more cautious, particularly in providing loans to certain CRE sectors, such as the Office sector. As inflation begins to cool, real short-term interest rates are gradually rising which makes decisions about the allocation and deployment of capital challenging.
In this report we touch upon various elements of the CRE market conditions including industrial supply and demand, capital dislocations, availability of capital, and office owners’ lack of liquidity or availability of financing. As we have every quarter of late, we also provide our updated assessment of macro-economic conditions regarding inflation and the trajectory of interest rates.
The Table of Contents below can assist with navigating to a preferred section or getting a quick general take.
- Fund Updates: High level news on Fund activity.
- Real Estate Market Conditions: In this section, we will review:
- Industrial development slows. Are there further tailwinds?
- Will the ice break on CRE capital flows?
- A “Credit Crunch” in CRE, particularly for Office
- Macro Economic Conditions:
- Financial conditions ease, but how much damage has been done?
- Hikes are over; when do the cuts arrive?
Fund Updates
Fund III:
As our partners know, the ten remaining assets in Fund III are all exposed exclusively, or largely in the case of the two mixed-use assets, to the office market. All five of Fund III’s industrial investments have been realized at a profit, large profits in some cases. As both the trade and mainstream press have reported, demand fundamentals for office assets are poor, and values are down significantly. We are going through a major downturn in the office market. Our senior TEAM is quite tenured and very experienced, all of us having been through multiple down markets. We know what to do to preserve value and move through markets like this to the other side, emerging in calmer waters. It will take some time for values to recover, as fundamentals don’t look set to improve in the near term. It will be difficult to generate positive returns during this recovery period, but our TEAM is focused on doing so and recovering most, if not all the loss in value.For the third quarter in a row, we have an update on the sale process of “The Oaks”, a three building, single-story flex industrial set of assets within the Fund III & Fund IV portfolios, located in Charlotte, NC. At this point in the process, we have pivoted to sell the three assets (English, Twin and Scarlett Oaks) individually partly because smaller sale offerings are performing better than larger ones in this environment. A contract to sell Scarlett Oak was signed during the quarter, and the sale is expected to close in Early February.
Fund IV:
As mentioned above, the sale process for the “The Oaks” is continuing. We closed on the sale of English Oaks to an exchange buyer a few weeks after the 3rd quarter ended. This was a seamless execution by the TEAM, so much so the purchaser was effusive about our Charlotte TEAM’s assist throughout the process. As part of the loan paydown process arising from the sale proceeds of English Oak, we are working with the existing lender to restructure the current loan on the remaining Airport 7 (now 6) portfolio.Upon receiving Investment Committee approval this quarter, the TEAM closed on a 10+/- acre land parcel in North Houston to develop a spec front-load ~139,000 SF industrial building. We have secured both debt and equity via existing Griffin Partners relationships to complete this speculative industrial project. Considering the current capital markets environment driving higher required yields, this is a big WIN by the TEAM to secure the capital stack in an extremely volatile marketplace. We will provide more details in our next quarterly report.
Real Estate Market Conditions
If you’ve read the last several quarterly reports, you know we continue to provide brief observations on current commercial real estate (“CRE”) market conditions, which we call Griffin Partners Brief Takes:
Industrial tailwinds, no more?
- Fundamentals across the Industrial sector have continued a positive run over the last 11 plus quarters as summarized in the table below. The entire right-hand side of the table is relatively green (meaning good!), although we are starting to see cracks in some fundamentals as the amount of new deliveries exceeds absorption. As depicted on the left-hand side, pre-Covid, fundamentals had slowed with only 45.5 million square feet of new deliveries in 1Q2019. Since 2021 developers have been busy building massive amounts of product, an average of 115.4 million square feet per quarter since 1Q2021. That rate of new supply was double the average from 2019 through 2020. The new supply was responding to record amounts of demand as absorption exceeded supply for seven consecutive quarters, often significantly, ending in Q32023. As a result, the Industrial CRE sector has been resilient and so far, avoided any potential overhang of supply. Based on our internal data, we believe that new supply will begin showing significant decline this quarter, continuing throughout 2024. With continued growth of onshoring, manufacturing and e-commerce, the long-term outlook for industrial demand remains positive.

- Before the Fed slammed the brakes on new development via rapid interest rate hikes raising the cost of debt (the fuel that makes the CRE market run), new projects were able to be capitalized in 2021 and 2022, and those projects are still being delivered, although we are nearing the end of this surge. The US Industrial market witnessed approximately 1 billion square feet of new deliveries from 1Q2022 through 3Q2023 and overall US vacancy rate only rose to 4.9% (per 3Q2023 JLL U.S. Industrial Outlook Report). While vacancies did rise 70 basis points from 2Q2023, vacancies across the US remain relatively low considering this massive amount of new supply.
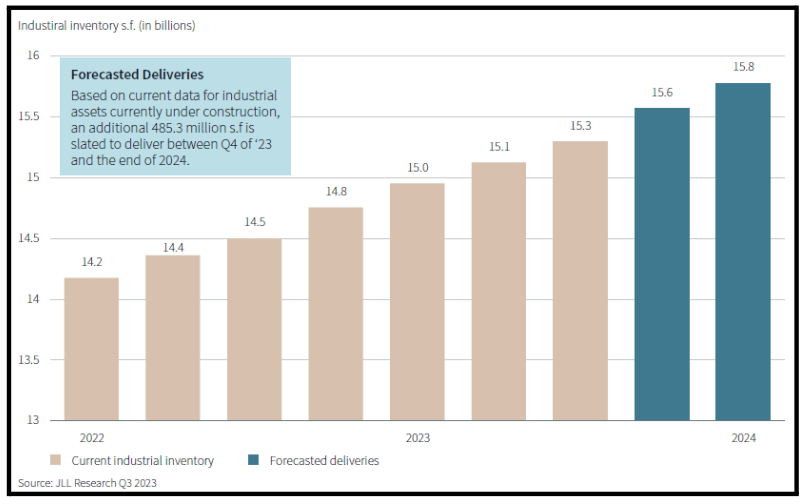
- How did all this happen in the last 3 years? As industrial fundamentals were in check and developers (as well as large institutions) were running from retail (momentarily), and sprinting away from office, a darling arose with whom to dance. His / her name was “Spec Industrial.” With low interest rates, strong fundamentals, alongside a sweet scent called “e-com”; the industrial CRE sector became a capital market darling. The nearby chart provides a picture of the continued industrial inventory growth that occurred since early 2022 and projections through 1Q2024.


Here are two more informative charts highlighting conditions in the industrial market.

Ice Breaker: Is 2024 the year CRE pivots to better times?
As 2023 is nearing its end, we look for better times ahead in the CRE sector. It’s been tough sledding for the last three quarters with extreme volatility in the marketplace. As Brian Pascus with the Commercial Observer stated, it’s been “…one of the most disruptive years in recent memory”.

- As we’ve stated over the last several quarters, interest rates will need to stabilize for capital flows to reignite. Pressure on the commercial banking sector will also need to normalize for the CRE sector, especially office, to start thawing and normal lending to resume.

Credit Crunch 2023 - CRE Dry Vine Vineyards
- So, when will capital begin to flow again? As stated above, the thawing will begin but it will likely be at least another 18-24 months before we see a more “normalized” market. What would define normal? Anecdotally, a normal market is when our TEAM calls upon a dozen or so equity or debt providers to pitch an opportunity, and at least six to seven of them say “yes, show us the deal.” That circumstance would be considered “normal” market feedback when seeking to capitalize transactions. Today, and over the last 9 months of 2023, of those dozen groups we call upon, maybe one says yes, if we have a tight deal perfectly fitting their narrow current criteria. For example, we were recently able to uncover a potential acquisition with an existing JV partner and were awarded a $75 million opportunity to acquire an existing industrial project in Austin. In this instance, every box was checked until a curve ball was hurled, and the transaction faded quickly. Shortly after we began the transaction process, a homeless shelter popped up nearby. This unexpected development caused some concern for our team and our JV partner. Despite the likelihood that we could have resolved this issue, it introduced an element of uncertainty. As a result, we decided not to proceed with the investment because it didn't meet all the criteria in this hyper cautious environment.
- As we mentioned in our most recent quarterly distribution letter “….we are actively engaged with the lenders to resolve technical defaults…[and] working to extend the maturities of several loans maturing next year (2024) and have been pleased with the progress of those efforts.” While we anticipate these discussions will lead to positive results with our relationship lenders, many owners are in more difficult circumstances.

Lastly, one of our trusted advisors, Michael “Gigs” Gigliotti, co-head of the New York office at JLL Capital Markets, stated in this WSJ article that “…many banks are trying to reduce their exposure to the struggling office sector, and the easiest way to do that is to not issue any new loans. Insurance companies also lend less, and borrowing from bond markets means accepting much smaller loans at much higher rates, leaving landlords with too little money to pay off their old loans.” This is quite the recipe for the latest vintage of Credit Crunch 2023 via CRE Dry Vine Vineyards.
Macro-Economic Conditions
Our conclusion last quarter proved to be accurate as of the date of publication. We concluded the Fed was “probably done; maybe one and done …”. Turned out to be done. At this point, most observers are now in full agreement with that conclusion, and the July 25th hike of 25 basis points to a target range of 5.25% to 5.5% looks virtually certain to be the last in this cycle.
Now the “oddsmakers” (punters in the interest rate futures market), have turned their attention towards an obsession with the timing of the first rate cut by the Fed. As we go to press, the forward curve is pricing in an almost 80% probability of the first rate cut being March 2025. Rhetoric from the Fed governors and Chairman Powell continues to have a hawkish tone, but most all their remarks are being ignored. In defiance of the Fed rhetoric, equity markets have leapt to recent highs, and the 10-year treasury has fallen a whopping 75 basis points from an October high of 5.0% to around 4.25%. The Goldman Sachs financial conditions index (FCI) showed a record easing in November. See chart nearby. Goldman’s web site says the FCI “is defined as a weighted average of riskless interest rates, the exchange rate, equity valuations, and credit spreads, with weights that correspond to the direct impact of each variable on GDP.”

So, will the Fed ease in March? Readers may remember from our missives last quarter that we postulated a possibility of Fed Chair Powell attempting to squelch the Greenspan Put. As such, we think a March rate cut may be a bit too optimistic. While March 2024 could very well be the time the economy enters into a recession, there is a high possibility that the Fed will remain restrictive several months into the any recession occurring in the first half of next year. We believe the most important two questions at this point will be:
- How much damage has been done to the economy by the rate hiking cycle, and
- If the magnitude of damage is significant, when will it become sufficiently obvious such that the Fed will be pressured to begin lowering short-term rates?
Damage in CRE Market
Our CRE Quick Takes above discuss the damage done by rate hikes to the CRE market. According to the Economic Impacts of Commercial Real Estate report published by NAIOP, the total commercial real estate contribution to U.S. GDP in 2022 was approximately $1.25 trillion for existing buildings and $1.04 trillion from development and construction. The $2.3T total represents about 8.9% of the total US 2022 GDP of $25.7 trillion. However, the contribution from existing buildings does not vary greatly from year to year and actually went up slightly during the 2020 Covid induced recession. The $1.04T of development and construction contribution comps to $700B in 2019, and $591B during the Covid recession in 2020. That 2020 volume is probably a good proxy for what we can expect in 2024 after adjusting for the lag from the precipitous drop in new project capitalizations to peak construction activity, and it also correlates roughly to the decline in transaction volume highlighted in our CRE section above. So, a reduction of $449B would equate to ~1.7% reduction in 2024 GDP. Fairly significant, but it is perhaps not sufficient in and of itself to push the total economy over the cliff.
Damage in the Broader Labor Market
We have closely examined conditions in the labor market for the past couple of quarters. There does not appear to be too much damage on the surface, but things may not be as rosy as they seem. EPB Macro Research defines the current conditions in the Labor Market using its Coincident Employment Index, a “composite basket of labor variables, including Nonfarm Payrolls, Aggregate Hours, the U-3 unemployment rate, and the Insured Unemployment Rate.

EPB: “Going back to 1970, the Coincident Employment Index has never moved into contraction outside of a recession, so the current 0.1% [October] growth rate should not be taken lightly. To be certain, the October Employment data was influenced by the UAW auto-strike, so we should be careful to jump to conclusions before that data is added back, but the growth rate in prior months has been near contraction as well. It’s clear that the Coincident Employment Index is far superior to Nonfarm payrolls as it moves into contraction earlier in all recessionary cases. Waiting for Nonfarm payroll growth to turn negative will always create an unnecessary lag time that can be picked up far earlier by this more comprehensive basket.”
The Conference Board produces an index called the Employment Trends Index (ETI), an 8-factor measure, which has steadily contracted for the past 12 months. The ETI is a leading indicator which accurately anticipates changes in EPB’s Coincident Employment Index.


Inflation & Rate Cut Timing
Core CPI inflation declined in October to 3.6% on a smoothed 6-month annualized basis, and headline PCE inflation declined to 2.8% on the same smoothed 6-month annualized basis, a fresh cyclical low. Core PCE inflation also fell to a cyclical low of 3.0% in October. Assuming a blended basis for all these figures equal to a conservative 3.5%, the current Fed Funds rate of 5.3% implies a real Fed Funds rate of 1.8%, the highest real rate since 2007. As the nearby chart depicts, the peak real rate has been trending down over the last several cycles as a result of secular conditions including excessive debt levels and demographics, topics covered frequently in many of our prior reports.
Because of this downward trend, it is more appropriate to compare the real rate only to the two most recent cycles, not those preceding the Global Financial Crisis (GFC). The overnight real rate has only been above this 1.8% level for roughly two years in the past two decades.

As we hit send on this report, the market has pushed the curve down even further, forecasting the overnight funds rates will fall almost 130 bps by year end 2024, starting in March. Our house view is that the rate fall will likely start a bit later than March and drop faster than the market currently believes.
