The tail-end of the 3Q-2021 for those ‘Stros fans was a fight to the finish. The competition was fierce and fun to watch. Similarly, we’ve witnessed heightened competition within the Commercial Real Estate (CRE) sector due to continued supply chain disruptions, rising inflation (transitory or not), and extremely low interest rates. A few examples of real-time competition include cost and delivery timing of materials, rising land prices, bidding wars on various CRE product types, lending exuberance across the CRE sectors, and the return of value-add office investors back to pre-pandemic volumes.
The Griffin Partners TEAM has been extremely busy in the last several months, and we will summarize below a few “GP brief takes”, current performance, and outlook of the US office market. We will also opine on rising inflation fears and the current interest rate environment. See the Table of Contents below to assist with navigating to a preferred section or getting a quick general take.
Real Estate Market Conditions
To summarize and provide our readers a few take-aways on current CRE conditions we are rolling out “GP brief-takes.” Some additional details follow the summaries for those who are interested. As indicated in our opening remarks, competition is strong across CRE sectors, and below are a few takeaways we’ve observed across both the industrial and office sectors as we continue to manage our existing portfolio and hunt for new office and industrial opportunities:
GP brief takes:
As Peter Linneman said in the early part of 2021, “…the US recovery will look like a butterfly, it will bob and weave, up and down, erratic at times with an unpredictable pace…” These words ring very true today. If you haven’t heard of Peter Linneman, click here, he is a trusted resource who we have followed for years.
Office Fundamentals
The butterfly analogy was illustrative of the office utilization data at least once thus far as the US office market started its recovery in the first half of 2021, and then the Delta variant this summer created a pause, slowing overall demand. Per JLL’s US Office 3Q-2021 report “numerous major tenants opted to extend their time frames for occupancy either to later in 2021 or out to 2022 due to the Delta variant.” This was a “ride the clutch” moment through 3Q-2021. Furthermore, this same report referenced “macroeconomic indicators remained optimistic, albeit slightly downgraded compared to forecasts from earlier in the year.” The positive news for our target markets was “…leasing activity rose once again in Q3, most notably in fast-growing secondary markets, while sublease space contracted modestly, and occupancy losses slowed once again.”
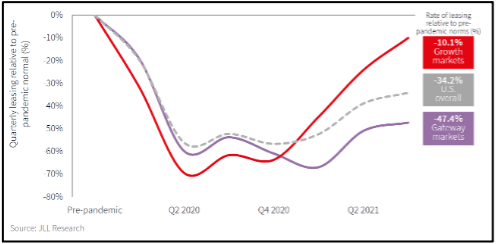
For several months now there has been a continuous drumbeat of positive news on the US office market. Our target markets have received the lion's share of the positive demand as COVID restrictions continue to wane. According to the latest statistics for 3Q-2021, secondary markets have gained the most positive leasing momentum as can be seen in the nearby chart from JLL Research. Gateway markets have been extremely slow to recover since the pandemic occurred in 2Q-2020 with a negative forty-seven percent (-47%) loss in overall leasing demand, which flattened again when the Delta variant occurred this summer. Conversely, as the chart also indicates, office leasing activity through the end of 3Q-2021 is almost back to pre-pandemic levels within the “Growth markets” with only a negative ten percent (-10%) change in volume compared to pre-pandemic volumes. Said differently, secondary “growth” markets are clearly outpacing the U.S. overall office market with a continued bounce to pre-pandemic or normal levels.
Further, large-scale leasing transactions are occurring, and savvy tenants are locking in “trough” rental rates with long-term leases. As can be seen in the table below, the smart folks in the room are making decisions, and it’s tipped the leasing term scales across the country towards longer lease terms.
During 3Q-2021, large transactions greater than 10+ years rose to greater than 40%, up from 23% early in the pandemic (3Q-2020). This has improved the weighted average lease term for newly signed leases from a trough of 4.8 years in 3Q-2020 to just above 6.7 years in 3Q-2021. This is very good news and will help stabilize the office environment over the next several quarters and years. Moreover, of the leases that were executed greater than 10+ years, 23% were “Tech” related companies, and an enormous 9 million square feet came from the “big-six” tech companies (Amazon, Apple, Apple, Facebook, Google, Microsoft, and Netflix)….no small figure considering folks a year ago said that “office was dead.” Far cry from it.
In contrast to the office market recovery after the GFC, it is the secondary markets leading the charge putting overall US office fundamentals on a positive trend as opposed to the “gateway” or primary markets which outperformed secondary markets following the GFC. The inflection point in the trend has also come over a shorter period in this cycle. Our readers have no doubt surmised the chief cause of the primary markets’ underperformance has been the generally stronger COVID restrictions in the urban cores of these large gateway markets. While the inflection point has arrived more quickly than the last downturn, the slow recovery will require some time before the US office market has a semblance of equilibrium, which in our world is when the building owners will achieve consistent negotiating leverage versus the current tenant-friendly environment.
As the following graphic depicts, negative absorption is slowing across the US. Our hunch is by YE2021 the US be on its way to positive office net absorption for the next few years. It’s worth noting as mentioned above, areas of the Mountain West and Sunbelt displayed positive net absorption due to the innovation-heavy geographies and the lack of new supply, positive signs for our target markets.
Our hunch about positive office using demand in 2022 is supported by NAIOP’s (a CRE development association) Office Space Demand Forecast published in November. The table on the next page shows NAIOP’s office space net absorption quarterly projections beginning with 4Q-2021. The forecast indicates each quarter will remain positive for the next 8 quarters through 3Q-2023. Most recently, NAIOP readjusted its office net absorption forecast upward from 1.8 million square feet to 8.3 million square feet (see table) in 4Q-2021, a re-forecast increase of four times. Why such a large swing in the data forecast? The primary reasons for this reforecast by NAIOP are continued “unemployment rate declines, more workers returning to the office and the economy continuing to improve.” These projections provide us the confidence that a resurgence in office-using employment will occur over the next several quarters as corporate leaders want their employees to mentor, collaborate, and push productivity. As we’ve stated in our 4Q-2020 quarterly report “…Employers need employees to be in the office to foster innovation, culture, and productivity” and further “historical evidence indicates, office using environments adapt and inevitably return to the mean when economies expand…”.
We also are seeing the early signs that companies are recognizing a lack of connection and engagement from some remotely working employees which is driving higher rates of employee turnover. The “Great Resignation” is the moniker being used by the press to describe the unusually high rates of employees quitting their jobs. While we don’t yet have the empirical data to convey to you, we are convinced that a significant factor in the high quit rates is the absence of true engagement for employees on teams that only meet virtually. If your only interaction with your team is a screen with fourteen little faces on it, twelve of which have their cameras turned off, it is hard for you to have much of an attachment to that team. Companies are beginning to realize that the cost of employee turnover is likely higher than the cost of their real estate.
A few other important factors have helped these positive office demand forecasts, primarily driven by continued economic growth, which per NAIOP forecast the “unemployment rate in September was 4.8%, down from 6.1% in April” [1] and the overall “GDP (Gross Domestic Product) rose at an annualized rate of 2.0% in 3Q-2021, a pace that cooled from the 2Q-2021 real GDP grow the rate of 6.7%” [2]. This GDP data points to yet another “butterfly” analogy that occurred in 3Q-2021 due to the COVID Delta variant.
All of which is a good segue into...
Macro-Economic Conditions
Inflation – Yep. All anyone discussing markets and economics can talk about now. As we went to press, the Federal Reserve Chairman, speaking in front of congress, finally retired the word “transitory.” Probably overdue. Many believe that the Fed has marched into a box canyon, with no good options at this point. Seems like a good idea to change terminology when you arrive in a box canyon. It now appears that the taper (reduction of monthly asset purchases a.k.a. QE) will be concluded on a more accelerated schedule than the one announced less than a month ago by the central bank. The market has also begun to price in rate hikes sooner than were recently anticipated. The rate for 2-year US treasuries has risen from 0.28% at the end of September to 0.56% as we go to press. Interestingly, the long end of the treasury curve, 10s and 30s, has been remarkably calm, if anything declining recently, thus flattening the curve. More on that in a moment. The problem for the Fed is that its traditional tool for addressing inflation, raising short-term interest rates, is one-dimensional, impacting only demand. Inflation can be, and in our present case very likely is, two dimensional, or with COVID, perhaps multi-dimensional.
Our readers are familiar with another dimension of inflation, the supply constraints widely discussed in the media and being blamed as the primary cause for the inflation we are experiencing. Raising interest rates is not likely to have a significant salutary impact on the easing of supply constraints. The Fed’s dilemma is described well by the economists at Wells Fargo: “If the run-up in inflation were driven simply by elevated demand across-the-board and labor market conditions beyond full employment, this traditional case of a positive output gap would likely call for tighter monetary policy. However, the unique drivers of inflation in today's economy may not be as sensitive to rate hikes. Tighter monetary policy cannot contain COVID, pull workers back into the labor force nor resolve short-term production outages in Asia.” This doesn’t mean the Fed should remain idle and not raise rates. As Wells Fargo points out, there two benefits that can come from higher rates: “tamp(ing) down demand in certain interest rate-sensitive sectors, such as durable goods and housing, as well as keep(ing) inflation expectations from becoming unmoored.”
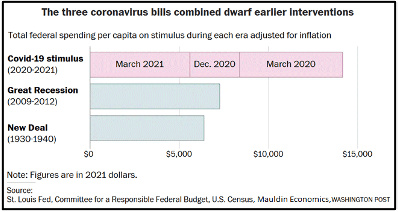
So how much of the current inflation is demand-driven, and how much is a result of supply constraints? We think inflation is coming mostly from a demand shock, not a supply shortage. This perspective is much less widely discussed, and obviously there are some exceptions, but at the macro level, demand, especially for goods, has outstripped a level of supply that by some measures is above its pre-COVID output levels. The principal culprit, a massive fiscal stimulus which on the whole exceeded the income lost during the shutdowns and thus greatly strained output capacity which was marginally impaired by the shutdowns. The nearby chart helps to visualize the number of stimulus dollars authorized by congress compared to two previous recessions. We don’t really need any words to describe that order of magnitude cash bomb.
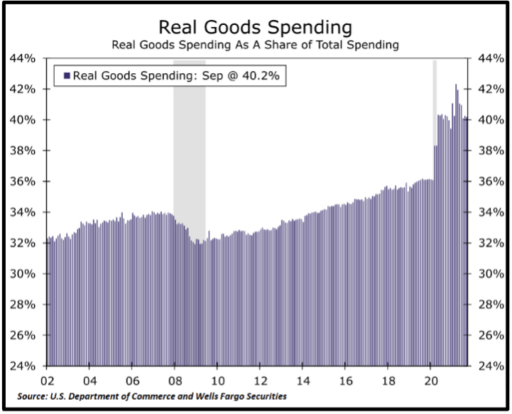
So, what did the recipients do with the largess from the three “interventions?” Many of them went online and bought stuff. Spending on goods exploded. The second chart clearly illustrates this spending binge. Many have heard the adage which goes the U.S. economy is 2/3rd services and 1/3rd goods. This ratio can be seen clearly on the chart with the spending on goods fluctuating between 32% and 34% from 2002 until 2018, and then rising slightly above that range immediately prior to the pandemic. But look what then happens when COVID hits. Real goods spending rockets up to a peak of over 42% in a matter of a few months. Logically this makes sense because the shutdowns had a much larger impact on service businesses than on the sale of goods. Obviously, the denominator in the ratio, total spending, shrank during the initial months of COVID, falling by 11% from 4Q-2020 to 2Q-2021, but had recovered to be down only 3% by 3Q-2021. So, the peak on the chart at a figure greater than 42% is over a denominator only 3% below pre-COVID levels. A finely tuned supply chain, stretched around the globe for maximum cost efficiency, would struggle to absorb a change with that order of magnitude.
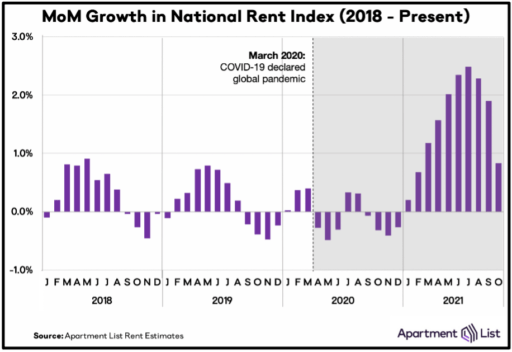
Coincident with this massive fiscal stimulus, the Fed engaged in an unprecedented quantitative easing (QE) exercise which pushed real interest rates sharply into negative territory, encouraging borrowing at historically low debt service costs. Some of this borrowing contributed to accelerating demand, particularly for housing. Home prices have jumped 20% on average during the pandemic, and apartment rental rates have increased significantly as well. Curiously, these much higher shelter costs have not been fully reflected in the inflation data yet, and as they do finally work their way into the data, will certainly be a tailwind for higher inflation prints for the next year plus. The nearby chart shows the very noticeable rise in apartment rents. Note those are month-over-month (MoM) figures, so a 2% MoM rise sustained for a year would be greater than a 24% annual rate. CPI is calculated using an “owners equivalent rent” (OER) methodology which many economists fervently believe is highly flawed. The OER is more than 25% of the total CPI. Simple math: 20% (rate at which home prices and rents are rising) times 25% equals 5% CPI just from rising shelter costs, yet the OER factors in recent CPI prints have been less than 2%. Something does appear to be amiss, and if it does work its way into future CPI prints more correctly, will have a big impact.
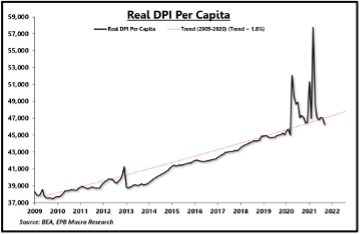
Is there any end in sight? Perhaps. The massive distortion of income from the blowout fiscal stimulus has ended. Congress did pass the physical infrastructure bill, but its spending is stretched out over many years, unlike the three COVID relief bills which dropped huge payments over a matter of a few months. Even if Congress passes the “human infrastructure” bill, it too will be spread out over several years and will not be near as much of a shock to the system. There is evidence that the excess income from fiscal stimulus has already abated. The nearby chart shows Real Disposable Personal Income (DPI) Per Capita. The chart shows DPI has already returned to its pre-COVID trend line and is ticking slightly below it. This return to trend for income, coupled with a shift back towards a more normal ratio of services to goods spending as a full reopening is achieved, could have a very meaningful impact on reducing demand to a level closer to what the supply side of the economy was designed to handle.
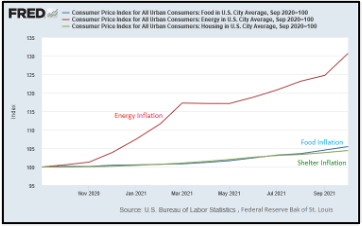
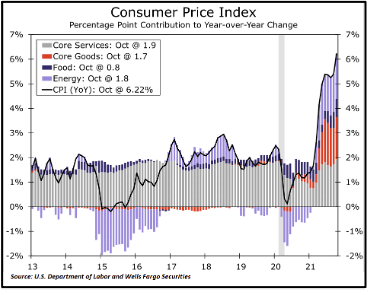
Also, energy prices have recently retreated, and even if they move back up to the levels seen in the early fall, there appears to be enough supply response to keep the impact on inflation well below what the economy experienced starting in early 2021. Readers will recall that we believe past bouts of above-trend inflation have frequently been driven primarily by energy costs shocking the system. Our most recent detailed discussion of this was in the 4Q-2020 report. Well…..…..we can’t let the opportunity go by without showing a couple of recent charts which may be adding evidence to our thesis. The two charts pretty much speak for themselves, so we won’t add a lot of words. One observation about the second chart though since it ties in to some of the comments above. Notice how the core goods component of CPI (red color portion of the bars) was a slight drag through most of the post-GFC recovery, but has been a significant positive contributor to higher CPI prints this year.
To balance things out, another matter we have opined frequently on may be about to challenge one of our core convictions on monetary policy. Increases in the money supply (M2) don’t have much effect when the velocity of money declines. More money in the system, but it is turning over fewer times, thus offsetting each other. One major factor, but not the only factor, influencing velocity is the propensity for banks to make loans. Loan growth has been anemic since the GFC. One of our readers sent us an article pointing out a significant increase in loan growth since June. Velocity may be increasing as a result. We will monitor it closely and likely report on it to you next quarter.
Our conclusion is that the instincts of this Fed to move cautiously and incrementally, means significant increases in rates likely won’t occur before the long-term fundamentals influencing economic growth, including adverse demographic trends, and excessive debt to name but two, together with the ending of massive fiscal stimulus bring growth back down to its probable new long-term trend below 2%. Inflation will regress to an associated lower level, removing the necessity for the Fed to raise rates further. These future conditions are what the stability of the long end of the interest rate curve are signaling.
[1] U.S. Bureau of Labor Statistics, “Economy at a Glance: United States – Monthly Data,” https://www.bls.gov/eag/eag.us.htm
[2] U.S. Bureau of Economic Analysis, “Gross Domestic Product, Third Quarter 2021 (Advance Estimate),” news release (October 28, 2021), https://www.bea.gov/sites/default/files/2021-10/gdp3q21_adv.pdf.
The Griffin Partners TEAM has been extremely busy in the last several months, and we will summarize below a few “GP brief takes”, current performance, and outlook of the US office market. We will also opine on rising inflation fears and the current interest rate environment. See the Table of Contents below to assist with navigating to a preferred section or getting a quick general take.
- Real Estate Market Conditions: In this section, we will give a brief review of the following:
- Competition is strong across CRE. We summarize via our “GP brief-takes” in regards to: construction costs, new and existing industrial pricing, land prices, aggressive new and refinancing debt fundings, and the increasing volume of value add office transactions.
- US Office fundamentals and how our target markets have assisted in the turnaround.
- Macro-Economic Conditions: In this section will assess rising inflation and interest rates, which will rise, but perhaps not as much as some think.
Real Estate Market Conditions
To summarize and provide our readers a few take-aways on current CRE conditions we are rolling out “GP brief-takes.” Some additional details follow the summaries for those who are interested. As indicated in our opening remarks, competition is strong across CRE sectors, and below are a few takeaways we’ve observed across both the industrial and office sectors as we continue to manage our existing portfolio and hunt for new office and industrial opportunities:
GP brief takes:
- Industrial construction pricing: The cost of construction materials is moving at lightning speed. All industrial developers are facing rising costs in concrete, steel, and roofing materials. Pegging these material costs to build industrial projects is key. The root causes of these cost increases are varied but the overriding theme is accelerating demand creating vigorous competition for these key building materials and outstripping supply. The competition and the supply constraints are driving up costs. We hope to see this dissipate, but for now we are padding our hard cost budgets by as much as 6-10% to account for these rising costs. Rents are rising in tandem.
- Existing & New Industrial pricing efficiency: We’ve witnessed firsthand the extreme amount of competition to build new as well as buy existing product. The cost of capital is extremely low, and institutions are pushing into the secondary markets and paying top dollar for new as well as existing industrial product. For example, an existing portfolio of well located (in-fill) industrial assets in Houston built in the early 1980’s, historically 93% leased, traded for approximately $105psf ($80+ million transaction). Within the same week of August 2021, a new 100% leased industrial project in the Port of Houston traded for $110psf ($100 million dollar transaction). The per square foot pricing was within 5%+/- and the in-place cap rate delta between the two trades was within 50 basis points, 5.0% cap rate for the existing and a 4.5% cap rate for the new product. This tight band of cap rates is a clear signal for us to push hard into building industrial versus buying existing assets in the near term.
- Industrial Land pricing: As we continue to spec our time searching for developable land sites, pricing continues to move at a quick pace within our current target industrial markets that include Salt Lake City, Dallas, Houston, Nashville, and Charlotte. In some instances, land prices are moving every 90+ days in these industrial markets. Thankfully, the Griffin Partners industrial land pipeline is currently full, with two actionable speculative industrial developments in the early phase of pre-construction and an additional four land sites under control in the early innings of pre-development diligence.
- Existing Office Refinancing competition: We are witnessing firsthand how aggressive lenders have become via two existing Fund III asset refinancings. In both cases, each asset consisted of office over retail, in well-established locations producing consistent cash flow with weighted average lease terms of greater than four years. The loan sizing for the refinancing’s ranged from $15 million to just over $22 million in total. In both cases, money center banks and regional banks were extremely aggressive at the 65% LTV levels, and in ALL cases the spread over LIBOR (now moving to SOFR) ranged from zero to ten basis point floors plus a spread of approximately 200 to 225 basis points. Terms are interest-only for a minimum of 36-months and in some instances, banks offered full-term 60-month interest-only options. This competitive landscape is good news for Fund III investors as this will further reduce our interest cost and assist in bolstering our quarterly distributions. Further, in each instance, our well-healed mortgage broker assisting in these processes had at least four lenders within striking distance of the same terms; an extremely competitive environment for a relatively small institutional loan size.
- Existing Value-Add Office transactions: During the pandemic, office investors were driven to find high-quality assets for safe and resilient income streams. Since the pandemic has waned, office investors are now rushing back into investing in value-add assets, primarily due to improving office fundamentals and office utilization slowly but clearly reverting back to something close to pre-pandemic conditions. JLL indicated in a recent report the “…value-add office pipeline has now recovered from the declines in 2020, and now recovering towards the 2017-2019 levels…”.
As Peter Linneman said in the early part of 2021, “…the US recovery will look like a butterfly, it will bob and weave, up and down, erratic at times with an unpredictable pace…” These words ring very true today. If you haven’t heard of Peter Linneman, click here, he is a trusted resource who we have followed for years.
Office Fundamentals
The butterfly analogy was illustrative of the office utilization data at least once thus far as the US office market started its recovery in the first half of 2021, and then the Delta variant this summer created a pause, slowing overall demand. Per JLL’s US Office 3Q-2021 report “numerous major tenants opted to extend their time frames for occupancy either to later in 2021 or out to 2022 due to the Delta variant.” This was a “ride the clutch” moment through 3Q-2021. Furthermore, this same report referenced “macroeconomic indicators remained optimistic, albeit slightly downgraded compared to forecasts from earlier in the year.” The positive news for our target markets was “…leasing activity rose once again in Q3, most notably in fast-growing secondary markets, while sublease space contracted modestly, and occupancy losses slowed once again.”
For several months now there has been a continuous drumbeat of positive news on the US office market. Our target markets have received the lion's share of the positive demand as COVID restrictions continue to wane. According to the latest statistics for 3Q-2021, secondary markets have gained the most positive leasing momentum as can be seen in the nearby chart from JLL Research. Gateway markets have been extremely slow to recover since the pandemic occurred in 2Q-2020 with a negative forty-seven percent (-47%) loss in overall leasing demand, which flattened again when the Delta variant occurred this summer. Conversely, as the chart also indicates, office leasing activity through the end of 3Q-2021 is almost back to pre-pandemic levels within the “Growth markets” with only a negative ten percent (-10%) change in volume compared to pre-pandemic volumes. Said differently, secondary “growth” markets are clearly outpacing the U.S. overall office market with a continued bounce to pre-pandemic or normal levels.
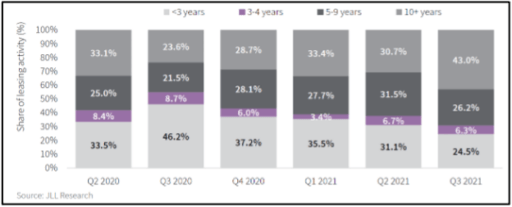
Further, large-scale leasing transactions are occurring, and savvy tenants are locking in “trough” rental rates with long-term leases. As can be seen in the table below, the smart folks in the room are making decisions, and it’s tipped the leasing term scales across the country towards longer lease terms.
During 3Q-2021, large transactions greater than 10+ years rose to greater than 40%, up from 23% early in the pandemic (3Q-2020). This has improved the weighted average lease term for newly signed leases from a trough of 4.8 years in 3Q-2020 to just above 6.7 years in 3Q-2021. This is very good news and will help stabilize the office environment over the next several quarters and years. Moreover, of the leases that were executed greater than 10+ years, 23% were “Tech” related companies, and an enormous 9 million square feet came from the “big-six” tech companies (Amazon, Apple, Apple, Facebook, Google, Microsoft, and Netflix)….no small figure considering folks a year ago said that “office was dead.” Far cry from it.
In contrast to the office market recovery after the GFC, it is the secondary markets leading the charge putting overall US office fundamentals on a positive trend as opposed to the “gateway” or primary markets which outperformed secondary markets following the GFC. The inflection point in the trend has also come over a shorter period in this cycle. Our readers have no doubt surmised the chief cause of the primary markets’ underperformance has been the generally stronger COVID restrictions in the urban cores of these large gateway markets. While the inflection point has arrived more quickly than the last downturn, the slow recovery will require some time before the US office market has a semblance of equilibrium, which in our world is when the building owners will achieve consistent negotiating leverage versus the current tenant-friendly environment.
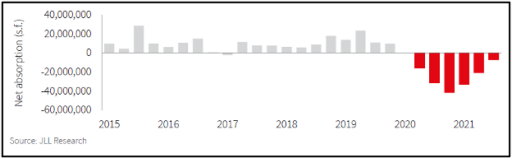
As the following graphic depicts, negative absorption is slowing across the US. Our hunch is by YE2021 the US be on its way to positive office net absorption for the next few years. It’s worth noting as mentioned above, areas of the Mountain West and Sunbelt displayed positive net absorption due to the innovation-heavy geographies and the lack of new supply, positive signs for our target markets.
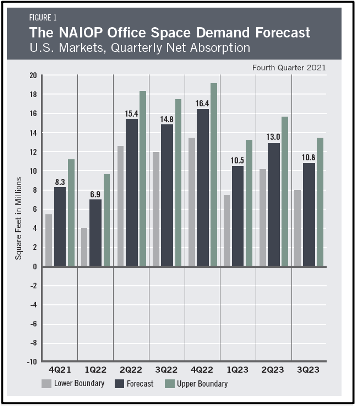
Our hunch about positive office using demand in 2022 is supported by NAIOP’s (a CRE development association) Office Space Demand Forecast published in November. The table on the next page shows NAIOP’s office space net absorption quarterly projections beginning with 4Q-2021. The forecast indicates each quarter will remain positive for the next 8 quarters through 3Q-2023. Most recently, NAIOP readjusted its office net absorption forecast upward from 1.8 million square feet to 8.3 million square feet (see table) in 4Q-2021, a re-forecast increase of four times. Why such a large swing in the data forecast? The primary reasons for this reforecast by NAIOP are continued “unemployment rate declines, more workers returning to the office and the economy continuing to improve.” These projections provide us the confidence that a resurgence in office-using employment will occur over the next several quarters as corporate leaders want their employees to mentor, collaborate, and push productivity. As we’ve stated in our 4Q-2020 quarterly report “…Employers need employees to be in the office to foster innovation, culture, and productivity” and further “historical evidence indicates, office using environments adapt and inevitably return to the mean when economies expand…”.
We also are seeing the early signs that companies are recognizing a lack of connection and engagement from some remotely working employees which is driving higher rates of employee turnover. The “Great Resignation” is the moniker being used by the press to describe the unusually high rates of employees quitting their jobs. While we don’t yet have the empirical data to convey to you, we are convinced that a significant factor in the high quit rates is the absence of true engagement for employees on teams that only meet virtually. If your only interaction with your team is a screen with fourteen little faces on it, twelve of which have their cameras turned off, it is hard for you to have much of an attachment to that team. Companies are beginning to realize that the cost of employee turnover is likely higher than the cost of their real estate.
A few other important factors have helped these positive office demand forecasts, primarily driven by continued economic growth, which per NAIOP forecast the “unemployment rate in September was 4.8%, down from 6.1% in April” [1] and the overall “GDP (Gross Domestic Product) rose at an annualized rate of 2.0% in 3Q-2021, a pace that cooled from the 2Q-2021 real GDP grow the rate of 6.7%” [2]. This GDP data points to yet another “butterfly” analogy that occurred in 3Q-2021 due to the COVID Delta variant.
All of which is a good segue into...
Macro-Economic Conditions
Inflation – Yep. All anyone discussing markets and economics can talk about now. As we went to press, the Federal Reserve Chairman, speaking in front of congress, finally retired the word “transitory.” Probably overdue. Many believe that the Fed has marched into a box canyon, with no good options at this point. Seems like a good idea to change terminology when you arrive in a box canyon. It now appears that the taper (reduction of monthly asset purchases a.k.a. QE) will be concluded on a more accelerated schedule than the one announced less than a month ago by the central bank. The market has also begun to price in rate hikes sooner than were recently anticipated. The rate for 2-year US treasuries has risen from 0.28% at the end of September to 0.56% as we go to press. Interestingly, the long end of the treasury curve, 10s and 30s, has been remarkably calm, if anything declining recently, thus flattening the curve. More on that in a moment. The problem for the Fed is that its traditional tool for addressing inflation, raising short-term interest rates, is one-dimensional, impacting only demand. Inflation can be, and in our present case very likely is, two dimensional, or with COVID, perhaps multi-dimensional.
Our readers are familiar with another dimension of inflation, the supply constraints widely discussed in the media and being blamed as the primary cause for the inflation we are experiencing. Raising interest rates is not likely to have a significant salutary impact on the easing of supply constraints. The Fed’s dilemma is described well by the economists at Wells Fargo: “If the run-up in inflation were driven simply by elevated demand across-the-board and labor market conditions beyond full employment, this traditional case of a positive output gap would likely call for tighter monetary policy. However, the unique drivers of inflation in today's economy may not be as sensitive to rate hikes. Tighter monetary policy cannot contain COVID, pull workers back into the labor force nor resolve short-term production outages in Asia.” This doesn’t mean the Fed should remain idle and not raise rates. As Wells Fargo points out, there two benefits that can come from higher rates: “tamp(ing) down demand in certain interest rate-sensitive sectors, such as durable goods and housing, as well as keep(ing) inflation expectations from becoming unmoored.”
So how much of the current inflation is demand-driven, and how much is a result of supply constraints? We think inflation is coming mostly from a demand shock, not a supply shortage. This perspective is much less widely discussed, and obviously there are some exceptions, but at the macro level, demand, especially for goods, has outstripped a level of supply that by some measures is above its pre-COVID output levels. The principal culprit, a massive fiscal stimulus which on the whole exceeded the income lost during the shutdowns and thus greatly strained output capacity which was marginally impaired by the shutdowns. The nearby chart helps to visualize the number of stimulus dollars authorized by congress compared to two previous recessions. We don’t really need any words to describe that order of magnitude cash bomb.
So, what did the recipients do with the largess from the three “interventions?” Many of them went online and bought stuff. Spending on goods exploded. The second chart clearly illustrates this spending binge. Many have heard the adage which goes the U.S. economy is 2/3rd services and 1/3rd goods. This ratio can be seen clearly on the chart with the spending on goods fluctuating between 32% and 34% from 2002 until 2018, and then rising slightly above that range immediately prior to the pandemic. But look what then happens when COVID hits. Real goods spending rockets up to a peak of over 42% in a matter of a few months. Logically this makes sense because the shutdowns had a much larger impact on service businesses than on the sale of goods. Obviously, the denominator in the ratio, total spending, shrank during the initial months of COVID, falling by 11% from 4Q-2020 to 2Q-2021, but had recovered to be down only 3% by 3Q-2021. So, the peak on the chart at a figure greater than 42% is over a denominator only 3% below pre-COVID levels. A finely tuned supply chain, stretched around the globe for maximum cost efficiency, would struggle to absorb a change with that order of magnitude.
Coincident with this massive fiscal stimulus, the Fed engaged in an unprecedented quantitative easing (QE) exercise which pushed real interest rates sharply into negative territory, encouraging borrowing at historically low debt service costs. Some of this borrowing contributed to accelerating demand, particularly for housing. Home prices have jumped 20% on average during the pandemic, and apartment rental rates have increased significantly as well. Curiously, these much higher shelter costs have not been fully reflected in the inflation data yet, and as they do finally work their way into the data, will certainly be a tailwind for higher inflation prints for the next year plus. The nearby chart shows the very noticeable rise in apartment rents. Note those are month-over-month (MoM) figures, so a 2% MoM rise sustained for a year would be greater than a 24% annual rate. CPI is calculated using an “owners equivalent rent” (OER) methodology which many economists fervently believe is highly flawed. The OER is more than 25% of the total CPI. Simple math: 20% (rate at which home prices and rents are rising) times 25% equals 5% CPI just from rising shelter costs, yet the OER factors in recent CPI prints have been less than 2%. Something does appear to be amiss, and if it does work its way into future CPI prints more correctly, will have a big impact.
Is there any end in sight? Perhaps. The massive distortion of income from the blowout fiscal stimulus has ended. Congress did pass the physical infrastructure bill, but its spending is stretched out over many years, unlike the three COVID relief bills which dropped huge payments over a matter of a few months. Even if Congress passes the “human infrastructure” bill, it too will be spread out over several years and will not be near as much of a shock to the system. There is evidence that the excess income from fiscal stimulus has already abated. The nearby chart shows Real Disposable Personal Income (DPI) Per Capita. The chart shows DPI has already returned to its pre-COVID trend line and is ticking slightly below it. This return to trend for income, coupled with a shift back towards a more normal ratio of services to goods spending as a full reopening is achieved, could have a very meaningful impact on reducing demand to a level closer to what the supply side of the economy was designed to handle.
Also, energy prices have recently retreated, and even if they move back up to the levels seen in the early fall, there appears to be enough supply response to keep the impact on inflation well below what the economy experienced starting in early 2021. Readers will recall that we believe past bouts of above-trend inflation have frequently been driven primarily by energy costs shocking the system. Our most recent detailed discussion of this was in the 4Q-2020 report. Well…..…..we can’t let the opportunity go by without showing a couple of recent charts which may be adding evidence to our thesis. The two charts pretty much speak for themselves, so we won’t add a lot of words. One observation about the second chart though since it ties in to some of the comments above. Notice how the core goods component of CPI (red color portion of the bars) was a slight drag through most of the post-GFC recovery, but has been a significant positive contributor to higher CPI prints this year.
To balance things out, another matter we have opined frequently on may be about to challenge one of our core convictions on monetary policy. Increases in the money supply (M2) don’t have much effect when the velocity of money declines. More money in the system, but it is turning over fewer times, thus offsetting each other. One major factor, but not the only factor, influencing velocity is the propensity for banks to make loans. Loan growth has been anemic since the GFC. One of our readers sent us an article pointing out a significant increase in loan growth since June. Velocity may be increasing as a result. We will monitor it closely and likely report on it to you next quarter.
Our conclusion is that the instincts of this Fed to move cautiously and incrementally, means significant increases in rates likely won’t occur before the long-term fundamentals influencing economic growth, including adverse demographic trends, and excessive debt to name but two, together with the ending of massive fiscal stimulus bring growth back down to its probable new long-term trend below 2%. Inflation will regress to an associated lower level, removing the necessity for the Fed to raise rates further. These future conditions are what the stability of the long end of the interest rate curve are signaling.
[1] U.S. Bureau of Labor Statistics, “Economy at a Glance: United States – Monthly Data,” https://www.bls.gov/eag/eag.us.htm
[2] U.S. Bureau of Economic Analysis, “Gross Domestic Product, Third Quarter 2021 (Advance Estimate),” news release (October 28, 2021), https://www.bea.gov/sites/default/files/2021-10/gdp3q21_adv.pdf.