As the heat wave continues over most of the US, we hope our readers had a relaxing summer and each of you were able to escape the high temperatures. The summer heat was one for the record books and so was Commercial Real Estate (CRE) pricing sector over the last 18+ months. Looking back, emerging from COVID, CRE witnessed strong demand, massive amounts of equity inflows, and a strong financing market, supported by low-interest rates, all of which combined to result in property price increases of more than 20%, a record. As we mentioned in our last quarterly report, the “drumbeat of continued rising interest rates” had begun, and real estate record pricing has begun to retreat with the Fed’s recent actions. This increase in rates has cooled investing in CRE. This quarter, we will focus on: 1) the anticipated slow-down, specifically price declines, 2) the continued work-from-home (WFH) risk for office and its impacts on where we invest our Fund capital, 3) the current CRE fundamentals across the US. For those a bit pressed for time, we provide our now traditional “GP Brief Takes”.
The Table of Contents below should assist readers with navigating to a preferred section or getting a quick general take.
- Fund Updates: High level news on our Fund activity.
- Real Estate Market Conditions: In this section we examine the following:
- “GP Brief Takes” from the last 90 days touching upon 1) banking or debt relationships - a key component to success in these periods of capital market uncertainty, and 2) a real-time commentary that office and select industrial asset pricing has retreated from record gains and the emergence of a widening bid-ask spread in the marketplace.
- Readers continue to inquire about the effects of office demand in a post-Covid environment. This is a very relevant question as it ties directly to our overall return performance within our Fund vehicles. Our TEAM continues to monitor the existing portfolio as well as stay in tune with our target markets’ office demand performance. Below we provide additional insight about the Work From Home (WFH) risk for office, and its impacts on different areas of the country, which are evolving into the “haves” and “have nots.” Lastly, some insights from thought leaders as to the pricing dislocation in the market.
- Macro-Economic Conditions: This section includes our thoughts on the following…
- Is inflation peaking in the U.S.? Does it matter for interest rates? Maybe, and it may not matter.
- Strong labor market conditions are helping the Fed act tough on rates. Is the labor market as strong as believed. There could be some cracks.
- The housing market has led the rebound from COVID, but higher rates have put on the brakes. The return to “normal” for housing as a proportion of economic activity could be painful.
- Will the Fed stay the course?
Fund Updates
Fund III: We continue to see glimmers of positive news on office leasing front, most of which is momentum in our suburban office assets with access to amenities or within in-fill locations providing tenants a quick commute. A shining star as of 2Q2022 has been 520 Post Oak, our TEAM has executed over 27,949 sf of leasing in the last 6 months, and the percent leased has improved from 61% in January 2022 to over 78% as of the date of this report, encouraging news for this asset which we expect will restabilize in the next 12 months. Further, Concourse at Westway has seen an uptick in leasing activity and we’ve increased the occupancy since 1Q2020 from 50%+- leased to currently 68% with more demand in the pipeline for this attractive asset.
Fund IV: Griffin Partners Income & Value Fund IV (“Fund IV”) remains open for new commitments through year-end 2022. Fund IV made two existing cash-flowing office investments during 4Q2021 in Charlotte and Houston, and we are on tap to make another strong cash-flowing office acquisition in the coming month. We also expect to add at least one more industrial land tract for development prior to year-end, to add to our three existing industrial investments.
Real Estate Market Conditions
The following are a few recent observations within CRE coupled with a few pages of more detailed material. First, real-time “GP Brief Takes” for this quarter:
- Debt relationships will be a valuable key to our success: Regardless of equilibrium or imbalanced markets, we do our best to provide investors and lenders an open book to our processes and strategies used to execute our business plans. This “open book” policy helps build lasting relationships and a trust factor that can only be earned. Considering the headline risk that the tide is out on office investing post-covid (more on that in the next section), we believe there is a window of opportunity to purchase high-quality office assets in locations which have been unattainable due to high valuations over the past several years. The key, in our opinion, to executing on these investments is having strong lender relationships that allow us to 1) borrow on reasonable terms during these times of uncertainty, particularly on office assets, and 2) provide us the certainty that these “relationship lenders” will close transactions in accordance with those reasonable terms. Fortunately, we have a number of lenders, (regional or super regional banks) that we can call upon to provide loan proceeds in various phases of an investment’s business plan. Many other potential buyers are either forced to pursue high coupon debt fund capital or no capital at all to finance an office investment. This is a unique situation that we have not seen for several CRE cycles. A global pandemic coupled with a confluence of various government and social factors have created a combination of recessionary expectations amidst a rising interest rate environment. We have been able to leverage our lender relationships (pun intended) to provide us an advantage in making sound investments on behalf of our Funds. For example, we have a relationship lender who has provided us four different loans since 2015 on office and mixed-use assets in our southeast target markets with loan sizes ranging from $5 million to $20 million. We recently were awarded an in-fill suburban office transaction (we can’t comment on the details just yet), and this particular lender provided us credit approved debt terms within ten days for $35 million in loan proceeds at a highly competitive rate. This lender relationship will most likely be pivotal in our success in this pending investment assuming all goes as planned…. foreshadowing for more details to follow next quarter!
- Office and Industrial asset pricing has cooled: As mentioned last quarter, we began seeing pricing decline for marketed office and industrial assets earlier this year. We noted that single-tenant industrial cap rates had moved up 50 to 75 basis points, and there was evidence this was bleeding into multi-tenant assets; we can affirm that this has occurred for both office and multi-tenant industrial. The short answer as to why; rising interest rates. More specifically, investors are unable to generate the same returns with interest rates increasing almost 2% in less than 100 days (previously 3.5% range now 6.0%+ range). In turn, prices must come down to offset the “negative leverage” investors are seeing today. For example, an investor previously paying a 5.25% cap for a stable asset would generate north of a 7% cash yield, due to borrowing cost rates well below the cap rate, a “positive leverage” scenario. Today, that same asset (office or industrial) may price around a 6.0% cap rate and borrowing cost rates are above this cap rate (closer to 7.0%), hence negative leverage. The upshot in these times of increasing rates, prices are coming down to generate equal or positive leveraged returns. Another factor in pricing fallout is lenders are not reducing their spreads. Typically, in a rising interest rate environment, lender spreads compress to partially bridge the increased debt cost, but, lenders are increasing their spreads (by the way, this is not a “typical” environment with massive amounts of dollars pumped into the system by the Fed). These forces are putting negative pressure on asset values, and in turn transaction volume for the second half of 2022 will fall by at least 20% from what occurred in the first half of this year. Any readers wishing to wager on 2022 second half total trade volume in CRE, let us know!
WFH Risk
This risk is top of mind in our approach to office and mixed-use investing. As part of our process to uncover WFH risk we monitor overall demand in our target markets monthly with our TEAM to understand many data points including demand givebacks (sublease movement) in our target markets, where new deliveries occur, specific product type demand (single story, mid-rise, high-rise…), as well as office suite configurations that are in demand for existing or potential customers/tenants.
As part of our never-ending search for the best data, we’ve recently subscribed to an additional real estate research service, GreenStreet. They provide us with excellent information including specific real estate intel such as e-commerce growth for industrial, demographic trends, cap rate trends, valuation movement, institutional and non-institutional trade volumes, market and submarket fundamental reports, etc..
GreenStreet recently updated a predictive index (born out of COVID) that projects the potential impacts of WFH on market-level office demand. We reported on this topic one year ago, in our 2Q2021 report, and shared the same graphic herein (now updated with new metrics). In short, this graph pits WFH “susceptibility” compared to population growth across the top 35 US metros. The markets are categorized into three buckets; Sun Belt Markets (Charlotte, Dallas, Phoenix, Salt Lake, Houston, etc..), Gateway Markets (Boston, New York, LA, etc..), and other Non-Gateway Markets (like Indianapolis, Memphis, or Cleveland).
A few key metrics that helped track office demand across the country have been added to GreenStreet’s WFH predictive index on overall office demand, these include: Affordability (homes prices and median incomes), Net Immigration, Commute Times, and Industry Concentration. Further, the following metrics helped but weren’t tipping the scales for altering the results of this index from previous years, those included, Growth in the working age population over 35, Median Household Income, and Overall Employment Growth. As our post-Covid world evolves, GreenStreet has smartly honed its process with new market-level data to assist in refining its susceptibility projections with new variables as mentioned above. The following graph or “map” of cities across the US has been updated as of 2Q2022 with GreenStreet’s new Score Framework for cities that are more, or less susceptible to potential office demand risk due to WFH.
As the exhibit above details, eight of our ten markets are in the BEST quadrant (upper left) or using GreenStreet’s vernacular, the “sweet spot” for being the least impacted by WFH (Raleigh-Durham is on the “goal line”, close enough!). Equally important, ALL are above the X-axis, which include ALL of our target markets, each exhibiting above-average population growth, no surprise. Lastly, the remaining two cities, Austin and Denver are just outside the “sweet spot” and sit in the upper right quadrant. The primary reason for Austin and Denver moving into this quadrant is two-fold, 1) commuting times which increase or provide a greater probability of being more susceptible to WFH, and 2) each of these markets has a larger degree of industry risk, Technology, which is more amenable to a liberal or open policy in regard to WFH. You will also notice that Austin is almost off the graph in the upper right quadrant due to the impressive population gains. The other takeaway from this “map” is ALL of the “Gateway” or “East or West Coast” markets are in the lower or right-side quadrants which are areas that are MOST susceptible to WFH. This is not an encouraging sign for the urban areas or central business ›districts of each of these major cities, mostly coastal cities across the US.
GreenStreet - Refining Market-level WFH Risk (June 2022)
Click here to request the full Q2 2022 Report.
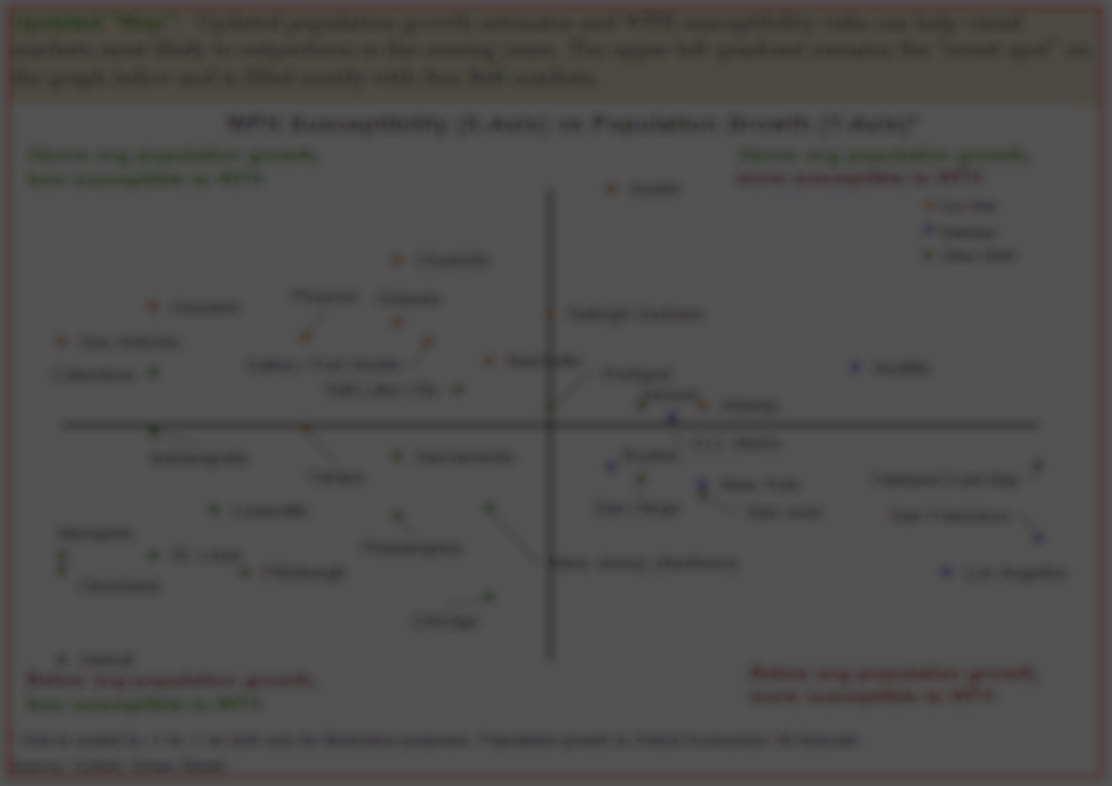
Overall, this index of the major markets indicates that “gateway markets are clearly more susceptible to demand reductions from the WFH than the Sun Belt and non-gateway markets.” Furthermore, population growth estimates still favor the Sun Belt markets and this projected growth is the “biggest hedge against remote work going forward – more so than industry concentration, commute times or any other factors.”
A recent article by Kyle Brown, President of Crown Commercial, entitled “Reports of Office Real Estate’s Death Were Greatly Exaggerated” stated in this post-Covid “…. aftermath it has proven that more companies than initially expected may return to traditional workspaces. Only 16% of companies worldwide are fully remote. In other words, for office real estate, the glass isn’t half empty; it’s roughly 84% full.” Lastly, per GreenStreet’s recent Office Insights 2Q2022 report, we are in our third year of the “Covid” era and are "….still within the relatively early stages for the adoption and use of increased remote working in the modern workplace. The story on the latest evolution of the modern workplace has not yet fully been written, but a fair betting line remains that some reduction in aggregate office demand is likely and that quality will prove to be a relative winner.” As we mentioned in past quarters our focus will be on functional office assets that we can either have in-place quality we can further enhance or the asset provides us an opportunity to upgrade the asset to a quality working environment needed to attract employees to come back to work.
Certain data point to a continuing uptick of office leasing activity across the US. According to Colliers 2Q21 report as follows:
GreenStreet - WFH Reassessing After Two Years (March 2022)
Reports of Office Real Estate’s Death Were Greatly Exaggerated (June 2022)
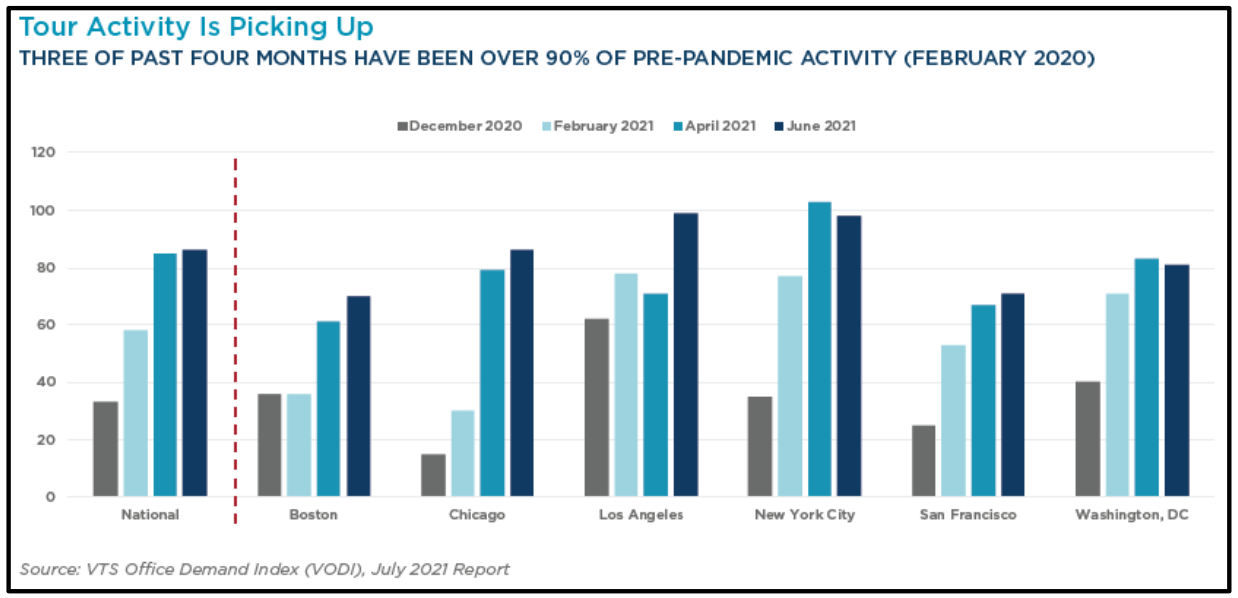
As the graph depicts the market has witnessed a steady increase of tour activity nationally and a few of the “gateway” markets have marked improvement in tour activity.
Additionally, overall Office fundamentals look to have turned the corner as follows:
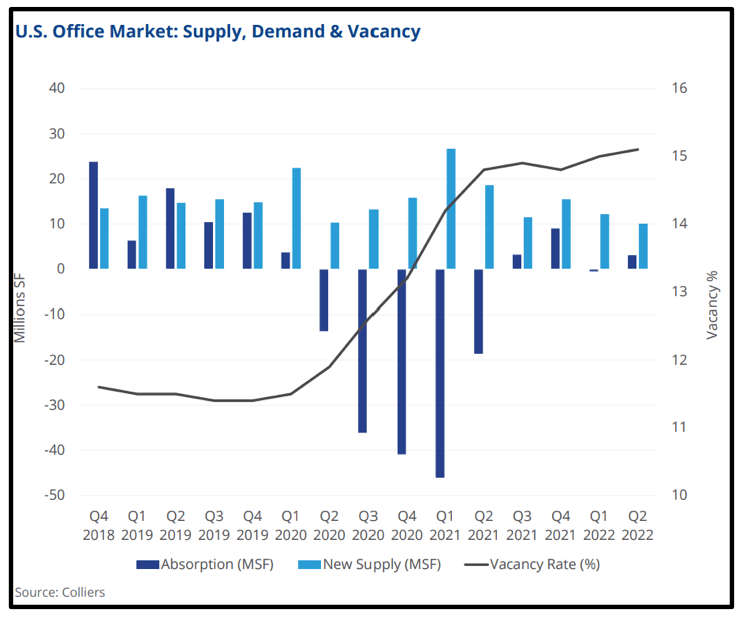
- U.S office absorption totaled 3.1 million square feet in 2Q2022, compared with negative 0.5 million square feet in 1Q2022.
- Positive absorption rose in 2Q2022 with 53% of office markets seeing gains in occupancy, up from 49% in 1Q2022
- Second tier metros such as Denver, San Diego, and Phoenix all saw over 500,000 square feet of positive absorption in 2Q22.
Lastly, office rate absorption has also been positive for four consecutive quarters as detailed in the nearby graph of US Office Market: Supply, Demand & Vacancy from Colliers 2Q2022 report. From 3Q2021 through 2Q2022 we have continued to see positive momentum since the dog days of COVID. This continued positive data are good; however, they are “…..soft, but not as soft as some people perceive,” said John Chang, senior vice president, national director research services, Marcus & Millichap. There were “only five quarters of net negative office space absorption {since} 2020 and we’ve been making a recovery, albeit sometimes slowly, since.”
GreenStreet - WFH Reassessing After Two Years (March 2022)
The most common perceptions of current office market demand are either 1) no office space is being absorbed or 2) only Class A office space is being absorbed – both are inaccurate, according to Al Pontius, senior vice president, national director, office and industrial divisions, Marcus & Millichap. The core office segment that faces the greatest challenges by the numbers are; 1) downtown areas, and 2) primary markets. Meanwhile, suburban, secondary/tertiary markets, and Class B and Class C office spaces show better momentum. The absorption largely outside of the urban core marks a behavioral shift as office demand trends change and companies strive to attract and retain employees. Per the latest Cushman & Wakefield 2Q2022 U.S. Office report suburban submarkets continue to outpace CBD submarkets. As the table below indicates since Covid began in early 2020 suburban office has outperformed CBD vacancies across the U.S.
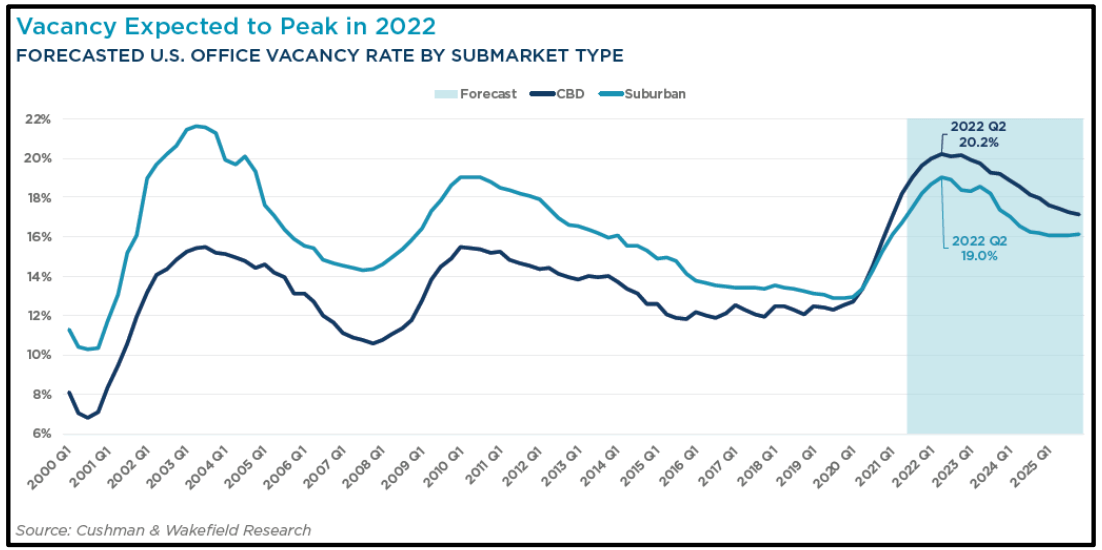
Colliers report indicates suburban demand has out-striped CBD demand starting in mid-2020; and most recently, suburban absorption totaled 3.9 million square feet in 2Q2022, compared to negative 0.8 million square feet across the CBD markets. Cumulative suburban absorption over the past four quarters was 18 million square feet, compared to negative 3.1 million square feet in CBD markets. All of our office investments are in suburban, infill markets.
RE Pricing and Transaction Volume Decline
As touched upon in the “GP Brief Takes”, overall pricing across the CRE sector has cooled and transaction volume in the last quarter fell dramatically. Real Estate Alert tracks the volume of sales where the transaction value exceeds $25 million. In a recent publication, Real Estate Alert reports the bulk of the activity in the first half of the year came in the first quarter with over $27.0 billion in trades but “…. sales slowed markedly in the second quarter, to $18.9 billion, amid sharply higher interest rates and broader economic turmoil. It was just the third time, since 2001 that a second-quarter decline occurred. The other two dips came toward the end of the Great Recession, in 2009, and the pandemic two years ago.” Despite the downtrend in volume, institutional investors will persist in buying Office to achieve overall required CRE allocations. It is simply too big of a CRE category to avoid.
Office trades for the second half of 2022 will not replicate the first half, as Mike McDonald, Vice Chairman of Cushman & Wakefield, stated in a recent Real Estate Alert article “it’s an awkward eighth-grade dance right now: boys on one side, girls on the other. No one is on the dance floor.” Great quote, which in a nutshell is analogous with the pricing disconnect that’s beginning to occur. Further, as a result of this awkward dance, sales have remained muted, bleeding into the third quarter, and as Ron Dickerman, President and Founder of Madison International Realty stated, “….we are seeing failed sales and pricing capitulation that are part of secular repricing in commercial real estate being driven by inflation and rising interest rates….”
As the negative headlines continue and limited positive news occurs, many investors will likely stay on the sidelines, and the CRE sector we will see a continued pullback in transaction volume through YE 2022. The primary reason is due to the rapid increase of long-term interest rates and continued inflationary pressures, which in short, creates little or no arbitrage for buyers today, forcing prices down, and causing both buyers and sellers to reevaluate their “dance moves.”
How is this affecting Office REIT Net Asset Value (NAV)? They are down across the board. The following table details how overall Office REIT asset values are performing as of mid-year 2022.
Colliers U.S. Research Report Q2 2022 Office Market Outlook
Real Estate Alert (July 2022)
Click here to request the full Q2 2022 Report.
The upshot of this table is office property values are down with cap rates up across the board, 20 bps per the chart above. NAV estimates and share values are down for Office REIT’s by an average of 5%. While the “average” is down “the sector does appear cheaper than at any point recently...” according to a recent report by GreenStreet. This market trend has continued as of the date of this report as the above REITs are trading downward an additional 20%+/-. However, while the office sector may be relatively cheap compared to history, “selection still matters as the sector is arguably facing an acceleration of obsolescence that is difficult to track (via Office REIT values) and moving up the quality spectrum is the surest bet for an office investor.” This “quality spectrum” is a key piece of our investment strategy as we continue to look for office investment opportunities. For example, as we’ve touched upon in our 1Q2022 report, we continue to “…..invest in efficient rectangular floor plates, high finished ceilings equal to or greater than 9’ along with “deck to deck” or “slab to slab” floors that are a minimum 12.5’ in height.” Further, we stated “the primary reason is flexible and efficient tenant space planning (low common area cost) and the ability to move fresh and recycled air through tenant spaces easily and at optimal volumes. This is extremely relevant in a post-COVID world.”
A few real-time examples of reset pricing are as follows: A recent in-fill multi-tenant industrial asset in Houston was offered for sale 90+ days ago, with a whisper price of $75 million or $100psf with a 4.75% cap rate. The WALT was just under 2 years and the potential buyer participants pushed back on this pricing as the major tenant (40% of the rent roll) was expiring lease extension with the major tenant for an additional five-year term, and the owner was able to increase in-place rents by approximately 20%. The asset was recently reintroduced to the market and the current ask has retreated from a 4.75% cap rate to a 5.25% cap rate or $67.5 million or $90psf. This multi-tenant industrial asset now has a longer WALT of approximately 3 years and the Seller has increased in-place income by over 20% although pricing expectations have fallen by approximately 10% and that’s the “ask.” Another example on the office side, an in-fill multi-tenant two-building portfolio came to market in Charlotte in early May this year with a “whisper price” of $63 million or $350psf. Fast forward to late June offers fell well below expectations at around $50 million or $280psf; a 20% swing in price. These are just two of the various examples we are seeing across the market. With the investment period for Fund IV underway, we believe there will be some excellent opportunities to pursue.
Macro-Economic Conditions
Perhaps discomforting for our investors, but we feel less certain than we have in quite a while about where the macro-economic conditions are heading in the near term. Without a doubt, growth is slowing in the U.S. and globally, and in many areas it has slowed to the point of contracting. While some argue, perhaps for political points, that the U.S. is already in recession, given the two consecutive quarters of negative GDP prints, enough data, including GDI (gross domestic income, the theoretically twin sibling of GDP), indicate overall growth is still positive. We do tend to agree with the consensus which promulgates that a recession is likely near on the horizon. However, how interest rates and Fed policy will react to the recession is very unclear. The Fed’s recent hawkish talk certainly paints a picture of a Fed determined to fight inflation with little consideration for its full employment mandate, or any other issues. Uncertainty arises because market participants may have other thoughts, and the likely duration of an elevated rate regime is an unknown. So, we will try our best to layout things as we see them, and what we generally believe will be the interest rate environment.
Peak or No Peak? Does It Matter?
Much has been made about whether July’s inflation report indicates inflation has peaked. We aren’t so sure it really matters. Unlike our initial assessment from the Q3 report last year, it now seems clear that inflation will not be retreating rapidly down to the 2%+ range professed by the Fed to be its target. Not transitory! Having also come to this realization, the Fed has turned up the rhetoric on rates, indicating the need to be “higher, for longer.” Even in Powell’s recent speech, he drew a contrast against the 1970’s Fed policy which failed to sustain higher rates as growth slowed and turned negative, thus seeding the sustained high inflation of the late 1970s. So, we will quickly examine the factors supporting the Fed’s tough rhetoric, at least for now, which include a tight and surging labor market and the continuing effects of highly stimulative monetary and fiscal policy (no, the Inflation Reduction Act is unlikely to have any impact on inflation, and the Fed knows it). And, we will try to weigh them against the longer-term factors likely to pose a drag on growth, poor demographics, over indebtedness, and return to normal of the highly cyclical, overstimulated housing and related durable goods sector.
U.S. employment numbers have indeed been quite good over the past several months, surprising to the upside. What is driving the strong jobs data, and will the strength hold up as financial conditions continue to tighten? One decidedly positive trend is the meaningful number of jobs being created by reshoring. According to a site called the Reshoring Initiative, American companies are on pace to return to the U.S. approximately 350,000 jobs this year, which is the highest number since data tracking began in 2010. Hopefully a trend that will continue, although potentially a tailwind for inflation, because without efficiency gains, the labor costs are bound to be higher for reshored operations.
A bit less sunny, there are a couple of interesting and possibly worrisome observations which several analysts are beginning to focus on in the current data. According to a recent survey of 700 US company executives by the global accounting and consulting firm PwC, about half of companies are planning to reduce headcount in the near term, and 52% of surveyed executives have put in place a hiring freeze. The survey also revealed approximately 40% of companies are rescinding job offers.
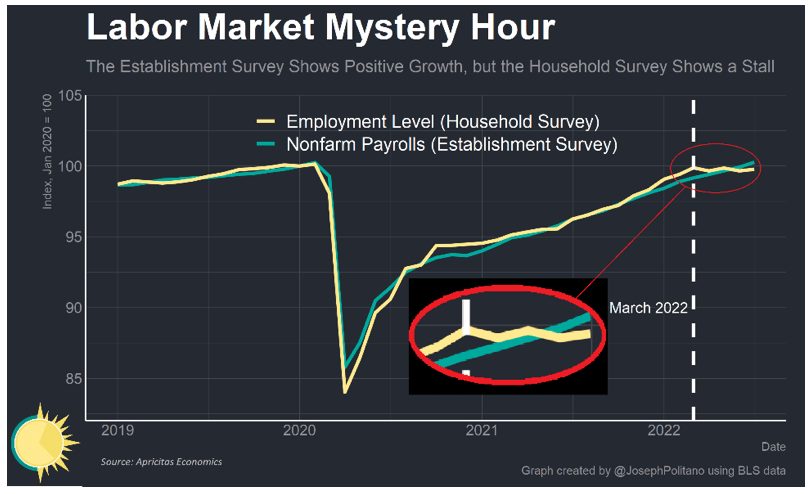
More interestingly, a discrepancy has developed between the two different employment reports produced by the Bureau of Labor Statistics (BLS), which usually track each other closely. Some are unaware there are two employment reports. The establishment survey tracks the payroll count of employers, and the household survey asks people if they have a job. In the headline U.S. economy adds 528,000 jobs in July, unemployment rate falls to 3.5%, number of jobs comes from the establishment survey and the unemployment rate comes from the household survey. But the household report also publishes an estimate of the number of jobs, and it has been painting a completely different picture of the labor market for the past four months. The nearby graph shows the divergence between the two since March, during which time the household survey indicates a loss of 168,000 jobs, and the establishment survey implies businesses added more than 1.6 million jobs. The two are measuring slightly different things, but even after adjusting for conceptual differences between the two, such as workers holding two jobs or moving from self-employment to an employer payroll, the household survey would estimate only a 722,000 increase in nonfarm payrolls since March, which leaves unexplained a difference of almost 1 million jobs. These job estimates may converge again over the next few months, but it is possible job creation has not been as strong as heralded.
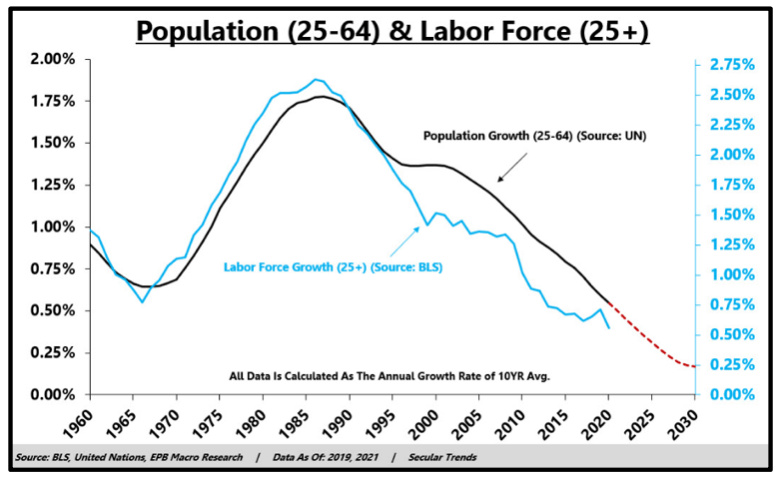
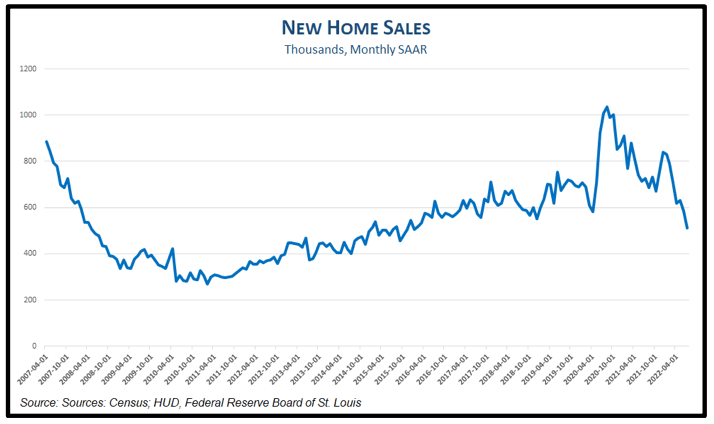
We concluded last quarter’s report by highlighting the declining demographics of the U.S. labor force, and its impact on the macro picture, so, we won’t reprise that theme here. It is worth noting however that while a shrinking workforce (see nearby chart) has the potential to keep reported unemployment lower, all else equal, the larger impact of a shrinking work force is slower economic growth. Global economic prospects are quite challenging. If not already in recession, Europe is facing a very high probability of contraction soon given the problems of higher energy prices, outright energy shortages, and ECB monetary tightening. For net energy importers like Europe, rising energy costs are like higher taxes, a drag on economic growth as resources are redirected out of the region. In the U.S., economic activity is slowing, partly as a result of Fed tightening, and partly from the indirect impact of slowing global growth. The housing market is slumping, and consumer sentiment has declined to levels associated with recession, most likely because wages, while rising, are not keeping up with inflation. The nearby chart of new home sales shows volume has declined to levels below the Q1-2020 recession, down 43% from the recent peak and approaching the sales volume last seen in the first few years after the Global Financial Crisis (GFC). According to EPB Macro Research, every decline of this magnitude in new homes sales has been followed closely by recession.
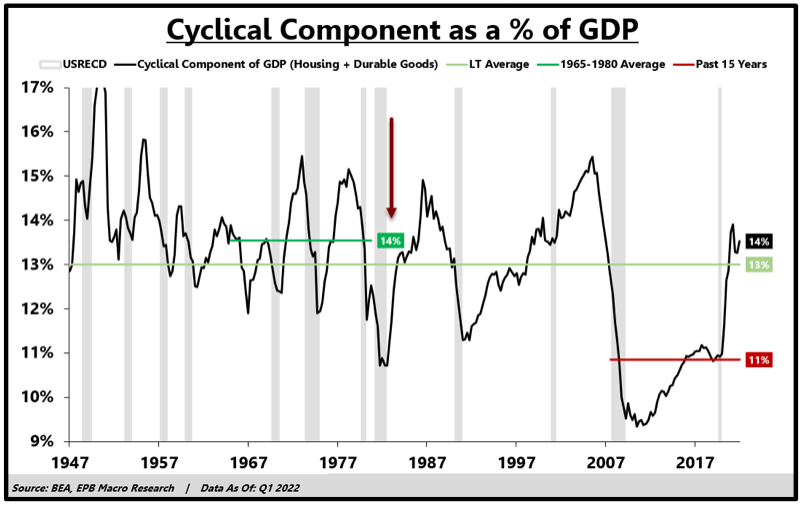
EPB has also done an interesting analysis showing how the excessively long accommodative monetary policy following the onset of COVID led to a boom in housing and durable goods, boosting their combined share of GDP to what is likely an unsustainable level. The next chart illustrates how those two components combined to represent 14% of GDP on average during the 15-year period from the mid-1960s to the end of the 1970s. Their combined contribution fell to an average of 11% of GDP in the 15 years following the GFC. After COVID, these two rate sensitive sectors took off and rose back to a 14% share of GDP. EPB: “The problem with the economy today is that we cannot continue to increase debt to fuel a housing boom. We know how that ends. We also don't have the demographic demand of the 1970s to sustain above-average levels of housing and goods consumption without increased debt. On top of that, interest rates are rising to their highest level in a decade. With high debt levels and weakening demographics, organic demand will force the share of housing and goods to fall back to the 11% range that it was after the GFC, which means the trip from 14% back to 11% will be just as painful as it was enjoyable on the way up. This boom was not caused by sustained organic demand; it was a one-time shock plus a debt binge that is now coming to an end.”
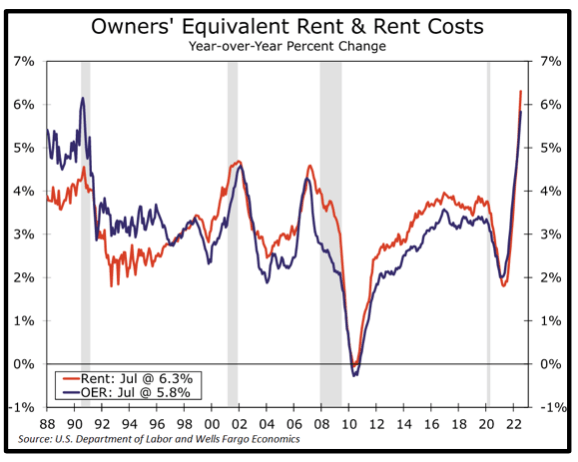
The housing acceleration you see in the graph above has yet to fully work its way into the inflation statistics, and despite the slowdown in housing activity now underway, is one of the reasons we are likely to see more persistent inflation. The largest component in the CPI calculation is shelter, at roughly one-third of the total, and the calculation is smoothed and intentionally lagged. The methodology to measure the cost of home ownership is called owners’ equivalent rent (OER), which is up 5.8% over the trailing twelve months and 7.3% over the past two years. See nearby chart. However, the S&P/Case-Shiller Home Price Index indicates home prices have risen by 37% in the two years ended March. The other shelter element is rent, and the BLS estimate of rental prices is called rent of primary residence (RPR), which is up just over 7% in the last two years and 6.3% year-over-year through July 2022. Also, in nearby chart. However, the CoreLogic Single-Family Rent Index has risen almost 15% in just the past year. Accordingly, the roughly one-third of CPI tracking shelter will be elevating the overall inflation statistics for a couple of years.
Eye on the Prize?
Unfortunately, the odds are rising that the U.S. is facing some degree of Stagflation in the near to intermediate term. The question in that scenario becomes: “Will the Fed stay the course?” Certainly, the statements coming from Fed officials, and just last week in a clear, stark fashion from Chairman Powell, indicates taming inflation is the only objective, and therefore the Fed is likely to see it through. There is already notable political pressure however to temper the tightening of monetary policy, and it remains to be seen if the Fed’s “independence” can endure that pressure all the way to the goal line. Call us partially skeptical on that score. Absent further geopolitical disruptions, admittedly a shaky presumption, we do still feel confident that the long-term macro forces of poor demographics and over-indebtedness will reassert their hegemony and return U.S. growth to its current long run potential around 1.5%. Whether that happens in late 2023, 2024 or 2025, we don’t know. All recessions result in lower interest rates, eventually, but our crystal ball on the timing and pace of the decline in rates is very murky. Best guess is a pause through most of 2023, a first cut in late 2023 or early 2024, but a long and slow path down.
Dogs, Ribs & Adult Beverages!
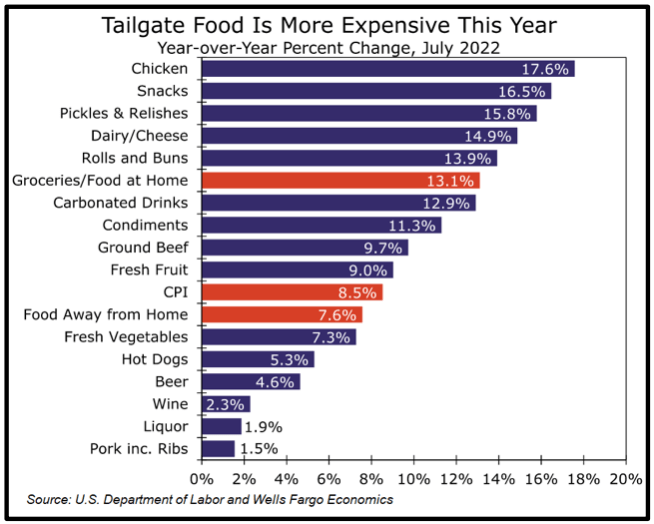
The Griffin Partners TEAM has quite a few football fans, with a very diverse rooting interest, which makes for some good-natured fun around the water cooler. And, we are big on tailgating. So, we want to leave you with some lighthearted inflation info as we sign off this quarter. There is a wide dispersion of inflation within the typical spread tailgate supplies. See the final chart. Fortunately, all of our most coveted items are distinctly at the low end of the list, hardly impacted by inflation at all!
