Looking back at this time last year our ‘Stros had a “fight to the finish” and lost the 2021 World Series (WS) in game seven; but this year our “Level Up” rally cry absolutely worked. Congrats to yet ANOTHER World Series win! Although our Astros repeated their WS appearance from twelve months ago, how different it looks today stepping up to the plate in the Commercial Real Estate (CRE) world compared to last year. CRE was “winning” 12 months ago with a continued churn of low cost capital and maybe a potential slow down looming. Today, CRE has been slowed dramatically by a Federal Reserve (“Fed”) induced capital markets stall. Although we’ve seen a slow-down, competition is still alive but at a much different pace across the broader markets. Inflation ran quickly, its highest in decades (it wasn’t transitory), and the Fed has turned on the interest rate hammer, the largest rates increase since the Volker era. Tough sledding for sure, following the “sugar high” of 2021 we mentioned in an early 2022 quarterly report. We have come to an abrupt turn in the markets.
The Table of Contents below can assist with navigating to a preferred section of our Market Thoughts or in getting a quick general take.
- Fund Updates: High level news on Fund activity.
- Real Estate Market Conditions: In this section, we will examine:
- A few “GP brief-takes” regarding the current world of debt maturities and in some cases “works outs” across the CRE sectors. We are not immune to this within our portfolio. A quick discussion of why industrial yields continue to expand. Lastly, we touch upon how capital allocations to CRE have remained strong, for now.
- As we mentioned last quarter, the “anticipated slow-down” is upon us, and in this section we summarize: 1) recently released historical data points detailing price declines across all CRE sectors, specifically office and industrial, and 2) the how the expansion of yields in industrial development is impacting supply in the short run.
- Macro Economic Conditions: This section includes our thoughts on:
- Fed Policy and what economic data the policy setting committee is likely focused on.
- Money Supply may still be important, despite the Fed not focusing on it.
- The U.S. wealth to GDP ratio is much higher than its long-term average and will mean revert at some point.
Fund Updates
Fund III: The Fund’s Concourse at Westway asset continues to experience an uptick in leasing activity. As of the publication of this report we are finalizing lease documents on two additional leases to move the building from 68% last quarter to over 82%. As a reminder we purchased the asset in 1Q2020 at ~50% leased. As a result of leasing success this year, 520 Post Oak is now projected to turn cash flow positive in Q1 of next year, a long slog back from the bankruptcy of the asset’s largest tenant right before COVID.
Fund IV: Last call! Griffin Partners Income & Value Fund IV (“Fund IV”) will conclude its fundraising period as of December 31, 2022. Fund IV has an initial seeded portfolio of six investments made since launching in 4Q-2021. These six assets include three (3) existing cash-flowing office investments within Charlotte (2) and Houston (1), and three (3) speculative industrial developments in various stages of construction located in Nashville (2) and Dallas (1). We are happy to report our third existing cash-flowing office asset, Roxborough I & II closed this past quarter, the Fund’s sixth investment. We are seeing solid leasing interest in our Port 45 industrial development in Dallas, despite only having poured the slab at this point. Encouraging!
Real Estate Market Conditions
Immediately below are a few recent observations on current CRE market conditions, followed by a few pages of additional detail on these themes. First, real-time “GP Brief Takes” for this quarter:
GP brief takes:
- Loan Extensions increase across the spectrum: Most lenders that are heavily allocated to CRE in today’s environment, especially office assets, are doing all in their power to extend loans two to three years to weather the current capital markets dislocation and the potential impacts of COVID on their collateral. 1st lien holders are initially not keen to take back an asset and operate it themselves. Lenders generally prefer to have motivated owners in place, allowing the lenders to “stay in their lane.” Generally, Lenders are not operators and managers of real estate, and frequently their decision capabilities are slower, and their view of the collateral and market dynamics is through a very different lens. Also, the real estate work-out teams many lenders had back during the Global Financial Crisis have largely been disbanded, and the associated skills atrophied. The number of work-out scenarios we are hearing about across the market is extensive, especially those that took on high LTC loans or highly levered mezzanine facilities that are maturing in the short term since pricing effectively peaked in mid-to-late 2019. For example, we just reviewed a $12.0MM in-place mezz debt facility being marketed on a 400,000 SF office asset in North Dallas that is maturing in 1Q-2023. The senior loan ahead of this mezz facility is near 80% loan to value. The asset is 62% leased and its highly unlikely in the next two years the asset will be able service the first lien much less the mezz debt facility. It’s clear in this situation the mezzanine lien holder will either sell their position at a steep discount or take over the equity holders’ position and make best efforts to restabilize the asset to protect the collateral. We are seeing these offerings on a weekly basis and if the right asset is presented with the appropriate attributes and a clear path to recovery, our Fund IV will look to take a senior or mezz loan position at a steep discount. Disruption creates opportunities in our view.
- Industrial yields blow out: The last 120 days we’ve seen a complete reversal of the trend in yields for industrial development, from compression to significant expansion. When institutional capital retreats and takes a wait and see attitude, it takes very little time for would-be developer capital coffers to dwindle, and in turn more expensive capital is required pushing yields up to meet the market. With institutional capital taking a pause, the industrial market has been dealt a tougher hand navigating higher debt costs and lenders who are even more cautious than the equity markets. At this point, we are in the early innings of a down cycle with debt cost almost doubling in the last six months.
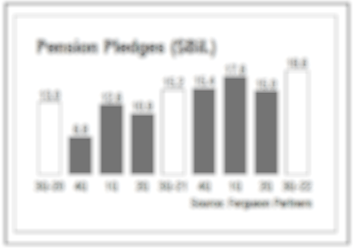
- CRE has staying power: Regardless of rising interest costs and historic inflation, institutional investors continue to allocate record amounts of capital to the CRE sector. For example, according to a recent Real Estate Alert publication in early November “U.S. public pensions pledged in the 3rd quarter of 2022 a record amount to commercial real estate vehicles despite macroeconomic conditions.” Per Ferguson Partners, who began tracking pledges since 2011, 3Q-2022 was a record quarter of $18.6 billion pledged, compared to previous peaks in 1Q-2022 of $17.6 billion which topped the previous record in 2018 of $17.3 billion pledged. These allocations will slow in the quarters to come but these large allocators will only slightly reduce their capital allocations as they are focused on long-term growth and are looking to invest through each cycle. Compared to other asset classes, the CRE sector remains attractive because of its historical return performance. We are believers in this long-term view, albeit the next few quarters will be difficult, but the assets we’ve invested in and those we plan to invest in the future have staying power for a multitude of reasons, including quality/class, functionality, location, credit profile, and most importantly low leverage.
Click here to request the full Q3 2022 Report.
As referenced in our opening remarks, the TEAM is continuing to witness price declines or dislocations across the entire CRE sector. Recently released 3Q-2022 data now proves up what we’ve witnessed in the trenches. The graph on the following page details price declines across all CRE sectors per GreenStreet’s latest Commercial Property Price Index (CPPI) over the last twenty years.
As you can see on the far-right hand side or top right quadrant of the graph below, the CPPI has been falling since earlier this summer. As referenced in prior reports, Green Street is a trusted institutional third-party data provider, and CPPI is a time series index of unleveraged US commercial property values that capture the prices of transaction under contract and closed.
Click here to request the full Q3 2022 Report.
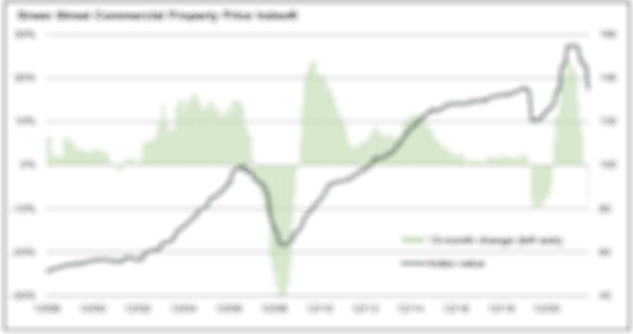
With some notable setbacks, the trendline for CRE values is positive over the twenty-year plus history. This is a testament to the long-term resiliency of the CRE sector. Looking further, you will see the CCPI fell dramatically in the turmoil of the Global Financial Crisis (late 2007 through 2009), took another very quick short-lived drop during the COVID pandemic (April 2020 through late 2020), and again CRE trades began to slow when the Fed began interest rate hikes (May 2022 to date). This Fed slow down, er induced recession (yet to be called) to fight inflation and effectively slow the overall capital markets has clearly worked thus far with respect to CRE.
Why did prices fall? Many factors, but the short answer is the power of negative leverage and its impacts on CRE pricing. What is that? It is the relationship of unleveraged yield from the property (operating income / cost) relative to the debt interest rate. For example, you purchase a cash flowing asset or speculative development with an unleveraged cash yield of approximately 5.5% and the debt interest rate is 6.5%, your equity return is upside down, debt rate higher than property yield. This creates negative leverage wherein you lose money by leveraging the asset. So, what must change to reverse or avoid this or bring the CRE market back to “normal” for the risk taken? The cost (price) of assets in this “higher interest rate” environment must fall.
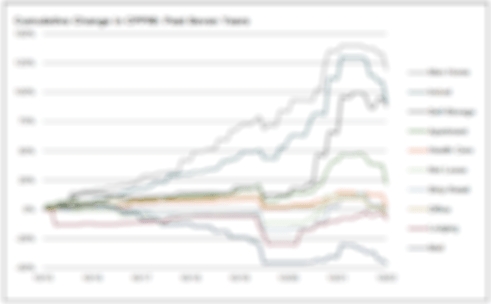
GreenStreet also provides a cumulative change of price in a much shorter time series over the last 7 years across the major sectors of CRE. In short, this steady increase of pricing was primarily driven by strong real estate fundamentals across asset classes coupled with strong credit markets or said differently, low cost of capital alongside “low” or nearly “zero” interest cost. As in all market cycles, things change quickly either through a global debt crisis, a world-wide pandemic, or a massive shortage in supply with extreme amounts of capital flooding the system.
All sectors will take a hit over the next twenty-four months as interest rate hikes wane and our economy heals; but in our view this breeds opportunity.
Peter Linneman provided an encouraging perspective in regard to our nation and economy as whole by stating in his last quarterly report (The Linneman Letter Summer 2022 Volume 22, Issue 2), what “….we have weathered since March 1, 2020. It is truly biblical: massive deaths and sickness from COVID, periods of extreme social isolation, massive economic shutdowns and business failures, unprecedented unemployment, social unrest and violence, inflation, closed schools, a highly contentious election cycle, “tourists” in the Capital building on January 6, 2021, a war in Europe, a shocking rise in gun violence, and much more (we are pretty sure that a plague of locusts is on the horizon). And yet, real [U.S.] GDP is about 3% higher than it was at the end of February 2020. What further proof do you need that it is a fool’s wager to bet against the U.S. economy? If you do not grasp this fact having just lived through the past 27 months, nothing we can say will convince you.”
Click here to request the full Q3 2022 Report.
Industrial Headwinds?
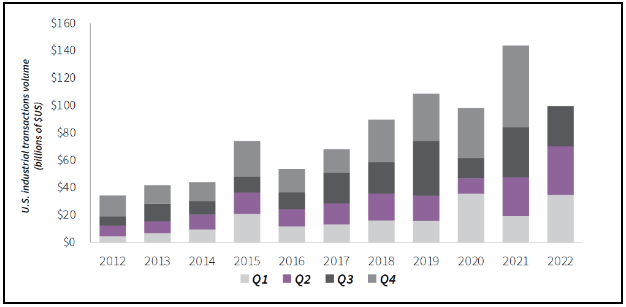
As we mentioned last quarter, the tide has gone out for existing marketed industrial assets. Since the peak of valuations in the first quarter of 2022, industrial cap rates have moved more than 100 basispoints upward. Unsurprisingly, as noted above, the major cause for this rise in cap rates is rising interest rates and investors being unable to generate investment return objectives amid the Fed policy of aggressive tightening. As the table below details, this has caused industrial transaction volume to slow significantly in 2022. Investors have also become more selective in what they buy in this environment. Widespread re-pricing of industrial assets has occurred in the last 90+ days and we have witnessed first-hand the decreased transaction volume. Along with staying close to the capital markets, we continue to monitor development activity and trends in order to be prepared as the cycle continues to mature and ready our capital for placement.
For now, momentum has driven continued increases in the speculative industrial new delivery pipeline. Per JLL, there is currently 627 million square feet under construction throughout the U.S. as of 3Q-2022, slightly up from 2Q-2022. A substantial portion, 182 million SF of this is pre-leased, or 29%. As of 3Q-2022, demand remains strong with over 350 million SF of industrial space absorbed, although 2022 will likely fall short of the 432 million square feet absorbed in 2021. At first glance, it appears that new industrial supply will outstrip the tenant demand going forward, leasing into headwinds of higher vacancy and decreased rent growth, albeit from substantially higher rents than were in place just two years ago.
Without a doubt, the industrial market has seen unprecedented returns and substantial growth over the past two years. However, rising interest rates and inflation have increased development costs, pointing to a break in future development action. Institutional investors (think pension funds, insurance companies, REITs etc.), the same ones who over the past 18 months have pushed billions of dollars in capital into industrial development amid lower interest rates, have shown signs of hitting the brakes. Why? Because they have become apprehensive about how to price investment returns in the midst of a higher interest rate environment and uncertainty about how far the Fed will go in aggressively tightening financial conditions in the economy.
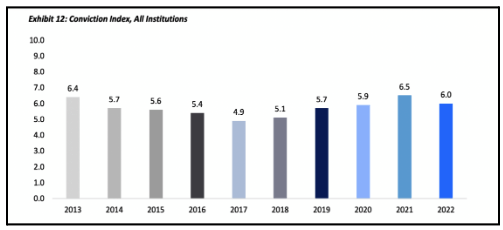
A recent survey asked institutional investors to rate on a scale from one to ten their view of investment opportunities in CRE from a risk/return perspective. The survey results shine a light into investors’ apprehension. As the table below indicates, institutional investor sentiment has decreased for the first time in five years, amid persistent inflation, rising interest rates, and fears of a future recession. Although it’s important to note that despite the decrease, sentiment in 2022 is still higher than when the market was booming in 2019 and 2020.
Over the last couple of months, the decline in institutional sentiment and its potential effects on speculative industrial development is no longer anecdotal, but a reality. Prologis, one of the largest owners, operators, and developers in the United States and around the world, recently announced that a trimming of plans for new industrial developments from $5.0 billion to $4.6 billion. Still a large allocation of monies to build new speculative projects but a pullback in spending will occur. All things considered, this reduction is relatively small at just 8%, but reflects an emerging trend of cautious sentiment from institutional investors. As Hamid Moghadam, the company’s co-founder and CEO stated: “I am concerned about inflation. I think the Fed’s going to overdo it, whether we have a recession or not…” HE also said Prologis will make decisions on new speculative development sites on a “deal by deal” basis.
Click here to request the full Q3 2022 Report.
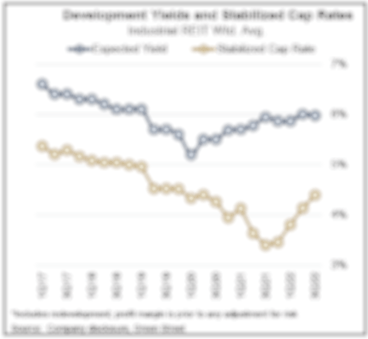
So, what does this mean for the future of industrial development in the short term and the industrial market as a whole? New industrial development starts have become riskier with lower profit expectations. Over the past few months, the Griffin TEAM, in our pursuit of new development projects, have seen investors who put land under contract months prior; drop land sites or attempt to re-trade land sellers. The main cause: developers originally underwrote returns that no longer “pencil” as interest rates and stabilized cap rates increased. As such, developers are left with the option of convincing land sellers to reduce the price to a level where they can achieve the “re-priced” yields, extend contracts to buy more time for the market to improve, or drop the site altogether.
The retreat of institutional capital, along with rising cap rates and higher required yields have made new industrial development projects significantly more difficult. In Nashville, where we have two projects already underway, one of which has a forward sale contract priced months ago at lower cap rates, only one building across the Nashville MSA broke ground in 3Q-2022, and the construction pipeline appears to be slowing slightly.
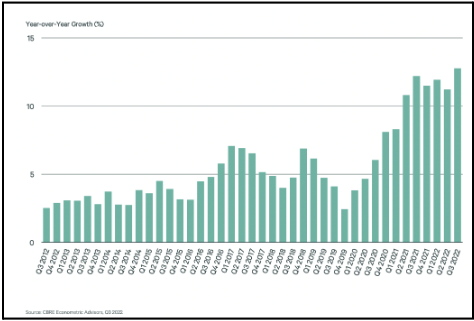
Meanwhile, the U.S. market vacancy rate continues to contract, with overall vacancy decreasing to 3.3% according to JLL. The graph nearby shows year-over-year rent growth continuing to increase at the highest rate since 2012. All of these metrics are incredibly positive, and we believe that positive momentum will continue in the near-term as this industrial development slowdown continues and supply tightens. As the COO of Blackstone, Jon Gray, put it, “in an environment like this, you start to see a reduction in new supply, which is obviously helpful in the long term; and these hard assets are beneficial because they don't have much exposure to input costs, [then] there's going to be [fewer real assets] built”.
Macro-Economic Conditions
Fed Policy
The Fed has only one, blunt tool, control of short-term interest rates, with which to achieve its dual mandate of price stability and full employment. Notably, because of a long period of policy rates set close to the zero bound, the mechanics of that tool are significantly different now than before the Global Financial Crises (GFC). It is not clear at this point whether that change in mechanics is benign or not. We tend to believe that paying banks to sequester reserves by depositing them at the Fed instead of investing them in loans or securities is counterproductive. Perhaps economic historians will examine this period a few decades from now and determine the impact on capital markets and economic efficiency. The Fed’s blunt tool works principally by cooling demand, but it also impacts supply primarily through lower investment in capacity and overall business sentiment. Optimum fiscal policy can help to bolster the supply side of the economy, but we won’t have better fiscal policy for at least 2 more years. Accordingly, current Fed policy is likely to break several critical elements of economic activity and possibly some over levered corners of the financial markets. What is unknown is whether the Fed has the political will to stay the course. Until very recently, the rhetoric emanating from members of the Fed’s policy committee has been designed to convince markets that the committee’s will is strong and therefore the Fed will stay the course, even though some argue it is not the best course. We are a bit skeptical about the resolve and think it likely there will be some back and forth, or at least some policy uncertainty.
Just like congress likes to meddle with the tax code instead of setting simple rules to follow over long investment cycles, the Fed prefers to meddle using discretionary policy rather than follow a set of rules that could potentially lead to less cyclical fluctuations in growth, or at least a lower magnitude in the fluctuations. The Fed calls this operating method “data dependent.” So, on what data are the committee members most likely to depend?
Data Dependent
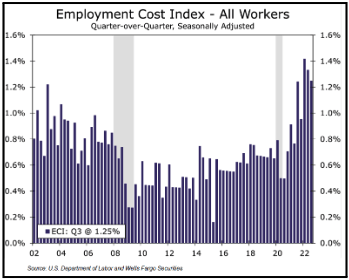
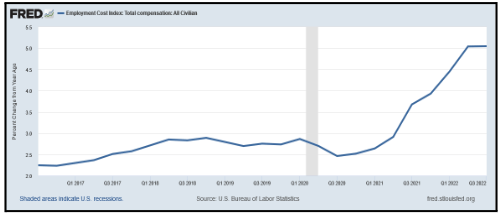
The economists we follow most closely believe there are three things to watch for clues on how the Fed views inflation: 1) the Employment Cost Index (ECI), 2) the rate of change in Personal Consumption Expenditures (PCE), and 3) the less widely acknowledged retail sales. The first two, ECI and PCE are showing some signs of moderation lately. The nearby chart, which shows the rate of change in ECI quarter over quarter, indicates both of the two most recent
PCE has also shown recent signs of moderating. The Fed prefers the PCE as an inflation gauge over CPI mainly because the manner in which it is constructed makes it less volatile and better adapted to changes in consumer behavior. For the past three months, PCE has indicated pricing pressures may be cooling coming in at 0.3% compared to a trailing three-month average of as high as 0.7% earlier in the year.

Fed Chair Powell recently said we may need to “unlearn” what we were taught in school about the importance of money supply with respect to economic growth and inflation. We are a bit uncomfortable with that notion and think money supply is worth keeping an eye on.
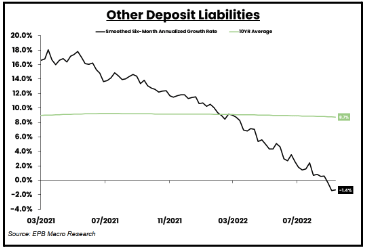
Other Deposit Liabilities of Commercial Banks is a measure of aggregate money similar to M2, but in the eyes of some economists a superior measure. ODL growth is now negative and is down markedly from a high of 18% in early 2021. See nearby chart. The 10-year average of ODL growth is 8.7%, and ODL growth has been below that average since March of this year. Contracting money supply is bound to have some impact on growth and inflation over the near term. EPB Macro Research calculates that by the end of first quarter next year, the three-year rate of growth in ODL will be “consistent with a longer-term trend rate of 2% inflation.”
Long-term Trends
It is impossible to pinpoint with accuracy the moment at which it becomes clear to all that the U.S., taken as a whole, is living beyond its means, but it feels like we are closer than we have ever been during the lives of all present generations. Which simply means things will have to change. Decades of relative prosperity, interrupted periodically with relatively mild retrenchments by historical standards, have produced a general level of comfort which allows for increasingly frivolous and less productive activities and malinvestment. This environment also enables bad policy choices, both fiscal and monetary, to be implemented and linger with muted consequences which never quite rise to a level sufficient to force change. One of the most endemic consequences is the escalating income disparities observed
We recently encountered an article by Absolute Return Research which examines wealth in the U.S. relative to GDP. It is interesting and well written, and we thought it best to simply quote some portions of it directly. We hope you find it equally interesting.
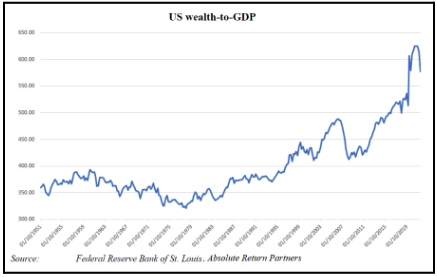
“Because US wealth has grown so dramatically since the mid-1990s, US wealth-to-GDP is now well above its long-term mean value, which is 380-390% (nearby chart). US wealth-to-GDP peaked in 3Q21 at 625%. Losses in financial markets have since reduced total wealth-to-GDP in the US to 578%, which is a meaningful drop, yet a drop in the ocean if (when) we are going back to 380% again. All this implies that, at some point, US household wealth will drop more than 30% unless the correction takes place through the denominator, i.e. if GDP continues to grow whilst wealth stays flattish. It goes without saying that it could also be a combination of the two.
Wealth-to-GDP is not as rich elsewhere, as it is in the US. In most of Europe, for example, we are currently 10-15% above the long-term mean value, not 30% above as the Americans are.
Think of wealth as capital and GDP as output. Wealth-to-GDP is thus a measure of how much capital it takes to generate $1 of output, i.e. it is a measure of capital efficiency. And because capital efficiency varies from country to country, wealth-to-GDP also varies.
Therefore, as the US is the most capital-efficient country in the world, it has the lowest wealth-to-GDP mean value. As I said earlier, the long-term mean value of US wealth-to-GDP is modestly below 400%. The fact that it is now 578% therefore suggests that, in the US, capital is not nearly as efficient as it once was.
Another way to measure the efficiency of capital in an open, capitalist economy is through the debt-to-GDP ratio, which is a measure of how much debt it takes to generate $1 of output. The more debt it takes, the less efficient the economy is. This links back to the first of ’our’ seven megatrends – Last Stages of the Debt Supercycle. In the early stages of all debt supercycles, debt-to-GDP is about 1, i.e. $1 of debt will generate $1 of output. As the debt supercycle matures, more and more debt shall be required to generate $1 of output.
All prior debt supercycles have collapsed when only $0.20-$0.25 of output is generated for every $1 of debt, and I note that both the US and China are approaching this ratio. Both are now below $0.30. The last debt supercycle to collapse was the one in Japan around 1990, and the next one to collapse will most likely be either the one in China or the one in the US – most likely the one in the US, as China is not an open, free-market, capitalist economy, meaning that the rule set is different.”
